Springfield SnackAbility
Overall SnackAbility
Crime in Springfield summary. We use data from the FBI to determine the crime rates in Springfield. Key points include:
There were 3,409 total crimes in Springfield in the last reporting year.
The overall crime rate per 100,000 people in Springfield is 5,886.6 / 100k people.
The violent crime rate per 100,000 people in Springfield is 1,371.1 / 100k people.
The property crime rate per 100,000 people in Springfield is 4,515.5 / 100k people.
Overall, crime in Springfield is 177.77% above the national average.
Total Crimes
Above National Average
Crime In Springfield Comparison Table
| Statistic | Count Raw |
Springfield / 100k People |
Ohio / 100k People |
National / 100k People |
|---|---|---|---|---|
| Total Crimes Per 100K | 3,409 | 5,886.6 | 1,844.9 | 2,119.2 |
| Violent Crime | 794 | 1,371.1 | 293.7 | 359.0 |
| Murder | 4 | 6.9 | 5.0 | 5.0 |
| Robbery | 138 | 238.3 | 45.5 | 61.0 |
| Aggravated Assault | 609 | 1,051.6 | 197.4 | 256.0 |
| Property Crime | 2,615 | 4,515.5 | 1,551.2 | 1,760.0 |
| Burglary | 518 | 894.5 | 206.0 | 229.0 |
| Larceny | 1,641 | 2,833.7 | 1,132.8 | 1,272.0 |
| Car Theft | 456 | 787.4 | 212.5 | 259.0 |
Source: FBI Uniform Crime Reporting (2024)
Cost of living in Springfield summary. We use data on the cost of living to determine how expensive it is to live in Springfield. Real estate prices drive most of the variance in cost of living around Ohio. Key points include:
The cost of living in Springfield is 85 with 100 being average.
The cost of living in Springfield is 0.8x lower than the national average.
The median home value in Springfield is $186,986.
The median income in Springfield is $47,143.
Springfield's Overall Cost Of Living
Lower Than The National Average
Cost Of Living In Springfield Comparison Table
| Living Expense | Springfield | Ohio | National Average |
|---|---|---|---|
| Overall | 85 | 90 | 100 |
| Services | 97 | 97 | 100 |
| Groceries | 98 | 97 | 100 |
| Health | 56 | 75 | 100 |
| Housing | 97 | 97 | 100 |
| Transportation | 95 | 95 | 100 |
| Utilities | 96 | 97 | 100 |
Source: Cost of living index, normalized to US average = 100
Springfield, OH Weather
The average high in Springfield is 61.7° and the average low is 42.0°.
There are 74.7 days of precipitation each year.
Expect an average of 40.9 inches of precipitation each year with 19.3 inches of snow.
| Stat | Springfield |
|---|---|
| Average Annual High | 61.7 |
| Average Annual Low | 42.0 |
| Annual Precipitation Days | 74.7 |
| Average Annual Precipitation | 40.9 |
| Average Annual Snowfall | 19.3 |
Average High
Days of Rain
Source: NOAA climate normals (30-year)
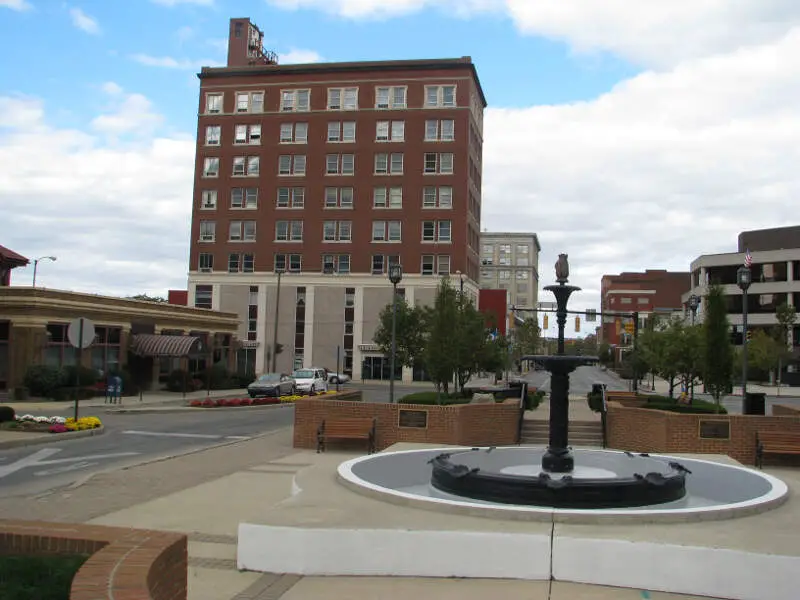
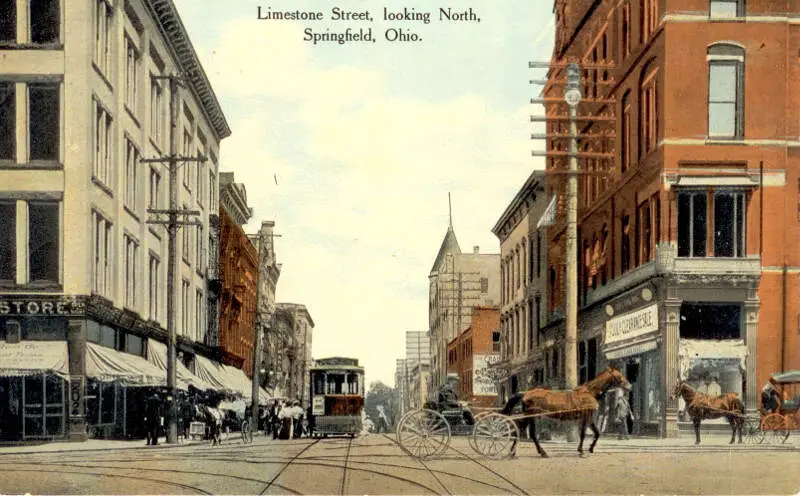
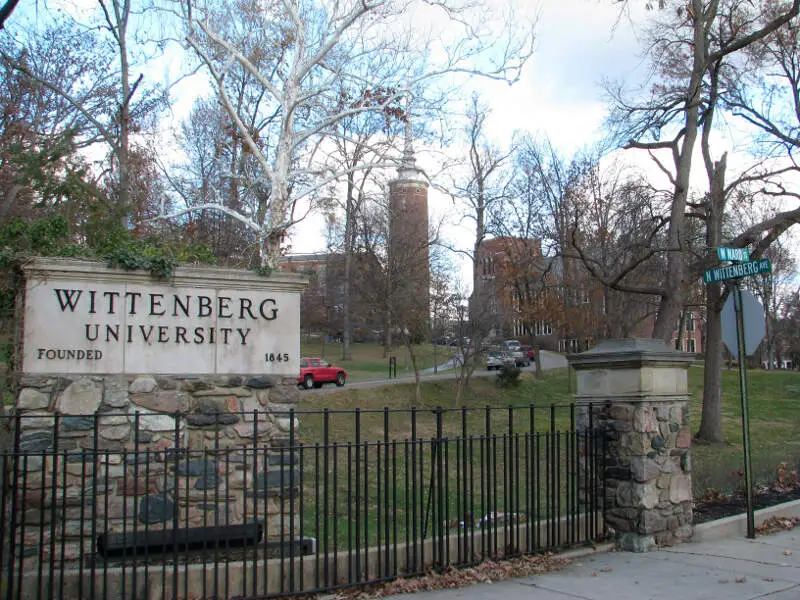
Springfield, OH Photos


4 Reviews & Comments About Springfield

We is by far the best city in Ohio to live in.
Springfield have gone from strictly depending on manufacturing for employment to a mixture of employers. Springfield has several industrial parks and Springfield Beckley Municipal Airport.
Springfield, Ohio has an abundance of group and organizations with events and programs. We are home to the John Legend Theater with year-round plays and programs.
We are home To Wittenberg University and Clark State Community College with wonderful Public and Private Schools.
Great amenities like a brewery with farmers market during winter months, ice arena, baseball, parks and recreation, fantastic Summer Arts Programs in Veterans Park.
Springfield Ohio is a dying city. Nothing really to do in downtown Springfield Ohio. We got a city mayor who is all talk no action plus a lot of business places are closing down. As for downtown Springfield Ohio, Hollywood can pretty much turn downtown Springfield into a Hollywood movie stage or into a Hollywood studio backlot. The only thing that's Good about Springfield Ohio is the video game store game cycle.Their employees are really nice. And yes the blue jackets chiller. The only thing that's Good about downtown Springfield is memorial day parade and Christmas lights in the city. Most of all Springfield Ohio is quite a dangerous place to live in.
I wish i could say Good things about Springfield Ohio but ever year it gets more ridiculou. Angd the sad part about it is if Springfield keeps going on the rough path the very worst that's going to happen is the fact Springfield Ohio might end up turning into a ghost town at some point in the future
Growing up in Springfield, I can honestly say I have witnessed the decline over the last 40 years first hand. We are to a point now that the crime is absolutely out of control. Nowhere within the entire city is it even remotely safe. There are absolutely no parts of town where one does not risk being assaulted, raped, robbed, or attacked. When I was younger, there were at least safer areas which everyone knew about and we could plan our day within those spots to avoid becoming a victim. Those lines have long since blurred. For instance, some of the fishing spots in some of the parks used to be mildly safe to enjoy. Now, it is practically suicide to fish without a weapon because the scumbag criminals are bleeding over into the forests and natural areas. Fact: if you live in Springfield for any length of time, you WILL be the victim of at least one crime! And, like mentioned, it does not matter what part of town you live in. Stay away, or if you are already here, try to find a way to escape. It is doubtful that it will get any better. Springfield is DEAD! As for me, I'm out. Leaving next year. And I can't wait!
There is absolutely nothing good about this joke-of-a-city at all!!!
Springfield is a great city, there is no crime and is just the right place to bring your kids and family, to have a great vacation. There are options other than vacationing in Springfield, if anything you should move here, it's safe, the community is together and everyone knows and loves each other. There is not one thing wrong with Springfield.
A good thing that stood out was the schooling system, here we have the best education known to man.
Rankings & Articles For Springfield


Locations Around Springfield
Map Of Springfield, OH
Best Places Around Springfield
Beavercreek, OH
Population 47,126
Northridge, OH
Population 7,817
Huber Heights, OH
Population 43,455
London, OH
Population 10,484
Fairborn, OH
Population 34,534
New Carlisle, OH
Population 5,544
Urbana, OH
Population 11,204
Xenia, OH
Population 25,689
Springfield Demographics And Statistics
Population over time in Springfield
The current population in Springfield is 58,190. The population has decreased 5.4% from 2010.
| Year | Population | % Change |
|---|---|---|
| 2024 | 58,190 | -0.4% |
| 2023 | 58,410 | -0.4% |
| 2022 | 58,645 | -0.6% |
| 2021 | 58,992 | 0.1% |
| 2020 | 58,957 | -0.3% |
| 2019 | 59,132 | -0.3% |
| 2018 | 59,305 | -0.2% |
| 2017 | 59,436 | -0.5% |
| 2016 | 59,761 | -0.4% |
| 2015 | 60,007 | -0.3% |
| 2014 | 60,216 | -0.3% |
| 2013 | 60,423 | -0.5% |
| 2012 | 60,728 | -0.6% |
| 2011 | 61,067 | -0.7% |
| 2010 | 61,498 | - |
Race / Ethnicity in Springfield
See the full breakdown
Springfield is:
69.3% White with 40,354 White residents.
17.3% African American with 10,047 African American residents.
0.0% American Indian with 22 American Indian residents.
0.4% Asian with 249 Asian residents.
0.1% Hawaiian with 84 Hawaiian residents.
0.2% Other with 120 Other residents.
7.0% Two Or More with 4,076 Two Or More residents.
5.6% Hispanic with 3,238 Hispanic residents.
| Race | Springfield | OH | USA |
|---|---|---|---|
| White | 69.3% | 75.8% | 57.4% |
| African American | 17.3% | 12.0% | 11.9% |
| American Indian | 0.0% | 0.1% | 0.5% |
| Asian | 0.4% | 2.5% | 5.9% |
| Hawaiian | 0.1% | 0.0% | 0.2% |
| Other | 0.2% | 0.4% | 0.6% |
| Two Or More | 7.0% | 4.3% | 4.3% |
| Hispanic | 5.6% | 4.8% | 19.3% |
Gender in Springfield
See the full breakdown
Springfield is 52.2% female with 30,384 female residents.
Springfield is 47.8% male with 27,806 male residents.
| Gender | Springfield | OH | USA |
|---|---|---|---|
| Female | 52.2% | 50.7% | 50.5% |
| Male | 47.8% | 49.3% | 49.5% |
Highest level of educational attainment in Springfield for adults over 25
See the full breakdown
2.0% of adults in Springfield completed < 9th grade.
12.0% of adults in Springfield completed 9-12th grade.
36.0% of adults in Springfield completed high school / ged.
23.0% of adults in Springfield completed some college.
9.0% of adults in Springfield completed associate's degree.
12.0% of adults in Springfield completed bachelor's degree.
4.0% of adults in Springfield completed master's degree.
1.0% of adults in Springfield completed professional degree.
1.0% of adults in Springfield completed doctorate degree.
| Education | Springfield | OH | USA |
|---|---|---|---|
| < 9th Grade | 2.0% | 3.0% | 4.0% |
| 9-12th Grade | 12.0% | 6.0% | 6.0% |
| High School / GED | 36.0% | 32.0% | 26.0% |
| Some College | 23.0% | 19.0% | 19.0% |
| Associate's Degree | 9.0% | 9.0% | 9.0% |
| Bachelor's Degree | 12.0% | 19.0% | 22.0% |
| Master's Degree | 4.0% | 9.0% | 10.0% |
| Professional Degree | 1.0% | 2.0% | 2.0% |
| Doctorate Degree | 1.0% | 1.0% | 2.0% |
Household Income For Springfield, Ohio
See the full breakdown
7.6% of households in Springfield earn Less than $10,000.
8.0% of households in Springfield earn $10,000 to $14,999.
9.7% of households in Springfield earn $15,000 to $24,999.
11.8% of households in Springfield earn $25,000 to $34,999.
15.5% of households in Springfield earn $35,000 to $49,999.
20.2% of households in Springfield earn $50,000 to $74,999.
10.5% of households in Springfield earn $75,000 to $99,999.
11.5% of households in Springfield earn $100,000 to $149,999.
2.5% of households in Springfield earn $150,000 to $199,999.
2.9% of households in Springfield earn $200,000 or more.
| Income | Springfield | OH | USA |
|---|---|---|---|
| Less than $10,000 | 7.6% | 5.2% | 5.0% |
| $10,000 to $14,999 | 8.0% | 4.0% | 3.4% |
| $15,000 to $24,999 | 9.7% | 7.1% | 6.3% |
| $25,000 to $34,999 | 11.8% | 7.5% | 6.6% |
| $35,000 to $49,999 | 15.5% | 11.6% | 10.1% |
| $50,000 to $74,999 | 20.2% | 16.9% | 15.5% |
| $75,000 to $99,999 | 10.5% | 13.1% | 12.6% |
| $100,000 to $149,999 | 11.5% | 17.1% | 17.5% |
| $150,000 to $199,999 | 2.5% | 8.3% | 9.6% |
| $200,000 or more | 2.9% | 9.1% | 13.4% |
Source: U.S. Census ACS 5-year estimates (2024)


