Trenton SnackAbility
Overall SnackAbility
Cost of living in Trenton summary. We use data on the cost of living to determine how expensive it is to live in Trenton. Real estate prices drive most of the variance in cost of living around Ohio. Key points include:
The cost of living in Trenton is 92 with 100 being average.
The cost of living in Trenton is 0.9x lower than the national average.
The median home value in Trenton is $279,523.
The median income in Trenton is $80,635.
Trenton's Overall Cost Of Living
Lower Than The National Average
Cost Of Living In Trenton Comparison Table
| Living Expense | Trenton | Ohio | National Average |
|---|---|---|---|
| Overall | 92 | 90 | 100 |
| Services | 98 | 97 | 100 |
| Groceries | 98 | 97 | 100 |
| Health | 89 | 75 | 100 |
| Housing | 99 | 97 | 100 |
| Transportation | 94 | 95 | 100 |
| Utilities | 98 | 97 | 100 |
Source: Cost of living index, normalized to US average = 100
Trenton, OH Weather
The average high in Trenton is 64.5° and the average low is 43.2°.
There are 73.0 days of precipitation each year.
Expect an average of 40.1 inches of precipitation each year with 11.0 inches of snow.
| Stat | Trenton |
|---|---|
| Average Annual High | 64.5 |
| Average Annual Low | 43.2 |
| Annual Precipitation Days | 73.0 |
| Average Annual Precipitation | 40.1 |
| Average Annual Snowfall | 11.0 |
Average High
Days of Rain
Source: NOAA climate normals (30-year)
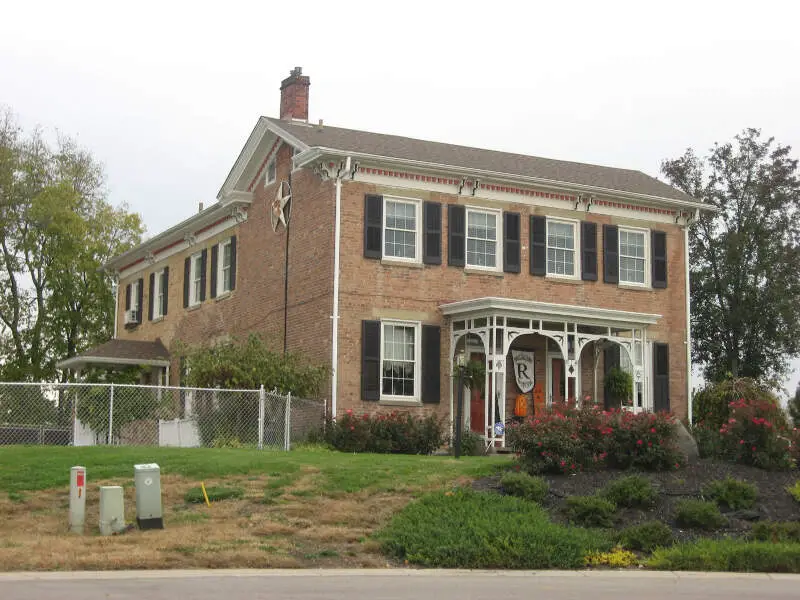
Trenton, OH Photos
Rankings & Articles For Trenton


Locations Around Trenton
Map Of Trenton, OH
Best Places Around Trenton
Wyoming, OH
Population 8,723
Montgomery, OH
Population 10,855
Mason, OH
Population 35,509
Kenwood, OH
Population 8,326
Springboro, OH
Population 19,980
Landen, OH
Population 7,499
Blue Ash, OH
Population 13,455
Deer Park, OH
Population 5,384
Loveland, OH
Population 13,197
Beckett Ridge, OH
Population 9,496
Trenton Demographics And Statistics
Population over time in Trenton
The current population in Trenton is 13,583. The population has increased 19.6% from 2010.
| Year | Population | % Change |
|---|---|---|
| 2024 | 13,583 | 2.1% |
| 2023 | 13,304 | 1.3% |
| 2022 | 13,133 | 1.2% |
| 2021 | 12,973 | -0.6% |
| 2020 | 13,046 | 1.1% |
| 2019 | 12,901 | 1.1% |
| 2018 | 12,755 | 1.2% |
| 2017 | 12,601 | 1.0% |
| 2016 | 12,477 | 2.5% |
| 2015 | 12,176 | 0.7% |
| 2014 | 12,091 | 1.0% |
| 2013 | 11,977 | 1.3% |
| 2012 | 11,823 | 2.0% |
| 2011 | 11,586 | 2.0% |
| 2010 | 11,354 | - |
Race / Ethnicity in Trenton
See the full breakdown
Trenton is:
95.4% White with 12,955 White residents.
1.1% African American with 154 African American residents.
0.0% American Indian with 0 American Indian residents.
0.1% Asian with 15 Asian residents.
0.0% Hawaiian with 0 Hawaiian residents.
0.0% Other with 5 Other residents.
1.4% Two Or More with 185 Two Or More residents.
2.0% Hispanic with 269 Hispanic residents.
| Race | Trenton | OH | USA |
|---|---|---|---|
| White | 95.4% | 75.8% | 57.4% |
| African American | 1.1% | 12.0% | 11.9% |
| American Indian | 0.0% | 0.1% | 0.5% |
| Asian | 0.1% | 2.5% | 5.9% |
| Hawaiian | 0.0% | 0.0% | 0.2% |
| Other | 0.0% | 0.4% | 0.6% |
| Two Or More | 1.4% | 4.3% | 4.3% |
| Hispanic | 2.0% | 4.8% | 19.3% |
Gender in Trenton
See the full breakdown
Trenton is 48.1% female with 6,528 female residents.
Trenton is 51.9% male with 7,054 male residents.
| Gender | Trenton | OH | USA |
|---|---|---|---|
| Female | 48.1% | 50.7% | 50.5% |
| Male | 51.9% | 49.3% | 49.5% |
Highest level of educational attainment in Trenton for adults over 25
See the full breakdown
4.0% of adults in Trenton completed < 9th grade.
6.0% of adults in Trenton completed 9-12th grade.
43.0% of adults in Trenton completed high school / ged.
21.0% of adults in Trenton completed some college.
9.0% of adults in Trenton completed associate's degree.
12.0% of adults in Trenton completed bachelor's degree.
4.0% of adults in Trenton completed master's degree.
0.0% of adults in Trenton completed professional degree.
1.0% of adults in Trenton completed doctorate degree.
| Education | Trenton | OH | USA |
|---|---|---|---|
| < 9th Grade | 4.0% | 3.0% | 4.0% |
| 9-12th Grade | 6.0% | 6.0% | 6.0% |
| High School / GED | 43.0% | 32.0% | 26.0% |
| Some College | 21.0% | 19.0% | 19.0% |
| Associate's Degree | 9.0% | 9.0% | 9.0% |
| Bachelor's Degree | 12.0% | 19.0% | 22.0% |
| Master's Degree | 4.0% | 9.0% | 10.0% |
| Professional Degree | 0.0% | 2.0% | 2.0% |
| Doctorate Degree | 1.0% | 1.0% | 2.0% |
Household Income For Trenton, Ohio
See the full breakdown
2.1% of households in Trenton earn Less than $10,000.
0.7% of households in Trenton earn $10,000 to $14,999.
5.7% of households in Trenton earn $15,000 to $24,999.
2.4% of households in Trenton earn $25,000 to $34,999.
12.4% of households in Trenton earn $35,000 to $49,999.
20.0% of households in Trenton earn $50,000 to $74,999.
18.7% of households in Trenton earn $75,000 to $99,999.
26.2% of households in Trenton earn $100,000 to $149,999.
9.1% of households in Trenton earn $150,000 to $199,999.
2.7% of households in Trenton earn $200,000 or more.
| Income | Trenton | OH | USA |
|---|---|---|---|
| Less than $10,000 | 2.1% | 5.2% | 5.0% |
| $10,000 to $14,999 | 0.7% | 4.0% | 3.4% |
| $15,000 to $24,999 | 5.7% | 7.1% | 6.3% |
| $25,000 to $34,999 | 2.4% | 7.5% | 6.6% |
| $35,000 to $49,999 | 12.4% | 11.6% | 10.1% |
| $50,000 to $74,999 | 20.0% | 16.9% | 15.5% |
| $75,000 to $99,999 | 18.7% | 13.1% | 12.6% |
| $100,000 to $149,999 | 26.2% | 17.1% | 17.5% |
| $150,000 to $199,999 | 9.1% | 8.3% | 9.6% |
| $200,000 or more | 2.7% | 9.1% | 13.4% |
Source: U.S. Census ACS 5-year estimates (2024)


