Warren SnackAbility
Overall SnackAbility
Crime in Warren summary. We use data from the FBI to determine the crime rates in Warren. Key points include:
There were 1,286 total crimes in Warren in the last reporting year.
The overall crime rate per 100,000 people in Warren is 3,302.3 / 100k people.
The violent crime rate per 100,000 people in Warren is 439.1 / 100k people.
The property crime rate per 100,000 people in Warren is 2,863.2 / 100k people.
Overall, crime in Warren is 55.82% above the national average.
Total Crimes
Above National Average
Crime In Warren Comparison Table
| Statistic | Count Raw |
Warren / 100k People |
Ohio / 100k People |
National / 100k People |
|---|---|---|---|---|
| Total Crimes Per 100K | 1,286 | 3,302.3 | 1,844.9 | 2,119.2 |
| Violent Crime | 171 | 439.1 | 293.7 | 359.0 |
| Murder | 2 | 5.1 | 5.0 | 5.0 |
| Robbery | 38 | 97.6 | 45.5 | 61.0 |
| Aggravated Assault | 117 | 300.4 | 197.4 | 256.0 |
| Property Crime | 1,115 | 2,863.2 | 1,551.2 | 1,760.0 |
| Burglary | 282 | 724.1 | 206.0 | 229.0 |
| Larceny | 746 | 1,915.6 | 1,132.8 | 1,272.0 |
| Car Theft | 87 | 223.4 | 212.5 | 259.0 |
Source: FBI Uniform Crime Reporting (2024)
Cost of living in Warren summary. We use data on the cost of living to determine how expensive it is to live in Warren. Real estate prices drive most of the variance in cost of living around Ohio. Key points include:
The cost of living in Warren is 81 with 100 being average.
The cost of living in Warren is 0.8x lower than the national average.
The median home value in Warren is $122,599.
The median income in Warren is $37,887.
Warren's Overall Cost Of Living
Lower Than The National Average
Cost Of Living In Warren Comparison Table
| Living Expense | Warren | Ohio | National Average |
|---|---|---|---|
| Overall | 81 | 90 | 100 |
| Services | 100 | 97 | 100 |
| Groceries | 100 | 97 | 100 |
| Health | 47 | 75 | 100 |
| Housing | 98 | 97 | 100 |
| Transportation | 98 | 95 | 100 |
| Utilities | 95 | 97 | 100 |
Source: Cost of living index, normalized to US average = 100
Warren, OH Weather
The average high in Warren is 60.4° and the average low is 38.7°.
There are 89.7 days of precipitation each year.
Expect an average of 39.0 inches of precipitation each year with 35.2 inches of snow.
| Stat | Warren |
|---|---|
| Average Annual High | 60.4 |
| Average Annual Low | 38.7 |
| Annual Precipitation Days | 89.7 |
| Average Annual Precipitation | 39.0 |
| Average Annual Snowfall | 35.2 |
Average High
Days of Rain
Source: NOAA climate normals (30-year)
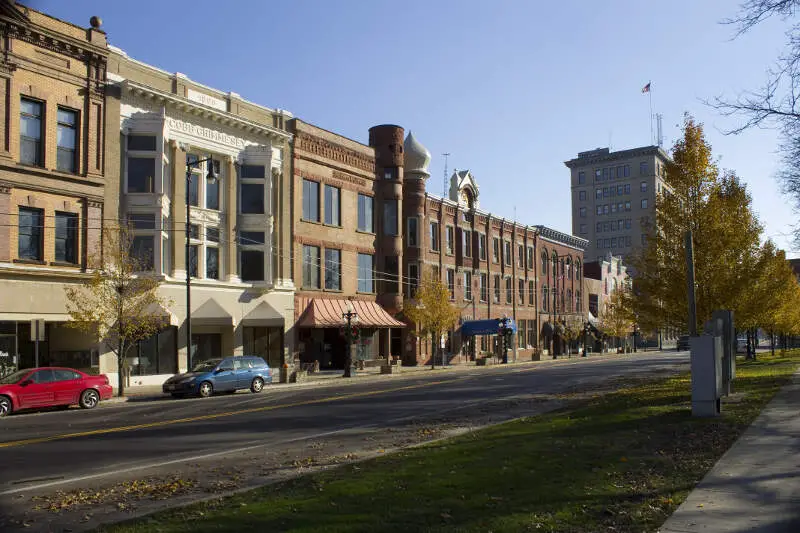
Warren, OH Photos
1 Reviews & Comments About Warren

I live in Warren it's part of the three Niles, Warren, youngstown its rough some guy just got shot in the neck a couple days ago a few houses up so I don't suggest moving here for anyone contemplating
Rankings & Articles For Warren


Locations Around Warren
Map Of Warren, OH
Best Places Around Warren
Canfield, OH
Population 7,649
Howland Center, OH
Population 6,266
Cortland, OH
Population 7,080
Champion Heights, OH
Population 6,380
Austintown, OH
Population 30,164
Hubbard, OH
Population 7,598
Struthers, OH
Population 9,923
Campbell, OH
Population 7,784
Niles, OH
Population 18,287
Warren Demographics And Statistics
Population over time in Warren
The current population in Warren is 38,912. The population has decreased 8.8% from 2010.
| Year | Population | % Change |
|---|---|---|
| 2024 | 38,912 | -0.4% |
| 2023 | 39,057 | -0.4% |
| 2022 | 39,204 | -0.3% |
| 2021 | 39,334 | 0.9% |
| 2020 | 38,986 | -0.8% |
| 2019 | 39,307 | -0.9% |
| 2018 | 39,668 | -1.4% |
| 2017 | 40,244 | -0.5% |
| 2016 | 40,433 | -0.7% |
| 2015 | 40,705 | -0.5% |
| 2014 | 40,925 | -0.7% |
| 2013 | 41,199 | -0.9% |
| 2012 | 41,569 | -1.4% |
| 2011 | 42,141 | -1.2% |
| 2010 | 42,667 | - |
Race / Ethnicity in Warren
See the full breakdown
Warren is:
62.6% White with 24,358 White residents.
27.0% African American with 10,505 African American residents.
0.1% American Indian with 27 American Indian residents.
0.8% Asian with 300 Asian residents.
0.1% Hawaiian with 38 Hawaiian residents.
0.3% Other with 112 Other residents.
5.8% Two Or More with 2,264 Two Or More residents.
3.4% Hispanic with 1,308 Hispanic residents.
| Race | Warren | OH | USA |
|---|---|---|---|
| White | 62.6% | 75.8% | 57.4% |
| African American | 27.0% | 12.0% | 11.9% |
| American Indian | 0.1% | 0.1% | 0.5% |
| Asian | 0.8% | 2.5% | 5.9% |
| Hawaiian | 0.1% | 0.0% | 0.2% |
| Other | 0.3% | 0.4% | 0.6% |
| Two Or More | 5.8% | 4.3% | 4.3% |
| Hispanic | 3.4% | 4.8% | 19.3% |
Gender in Warren
See the full breakdown
Warren is 50.2% female with 19,523 female residents.
Warren is 49.8% male with 19,389 male residents.
| Gender | Warren | OH | USA |
|---|---|---|---|
| Female | 50.2% | 50.7% | 50.5% |
| Male | 49.8% | 49.3% | 49.5% |
Highest level of educational attainment in Warren for adults over 25
See the full breakdown
2.0% of adults in Warren completed < 9th grade.
12.0% of adults in Warren completed 9-12th grade.
44.0% of adults in Warren completed high school / ged.
17.0% of adults in Warren completed some college.
9.0% of adults in Warren completed associate's degree.
12.0% of adults in Warren completed bachelor's degree.
3.0% of adults in Warren completed master's degree.
1.0% of adults in Warren completed professional degree.
0.0% of adults in Warren completed doctorate degree.
| Education | Warren | OH | USA |
|---|---|---|---|
| < 9th Grade | 2.0% | 3.0% | 4.0% |
| 9-12th Grade | 12.0% | 6.0% | 6.0% |
| High School / GED | 44.0% | 32.0% | 26.0% |
| Some College | 17.0% | 19.0% | 19.0% |
| Associate's Degree | 9.0% | 9.0% | 9.0% |
| Bachelor's Degree | 12.0% | 19.0% | 22.0% |
| Master's Degree | 3.0% | 9.0% | 10.0% |
| Professional Degree | 1.0% | 2.0% | 2.0% |
| Doctorate Degree | 0.0% | 1.0% | 2.0% |
Household Income For Warren, Ohio
See the full breakdown
11.4% of households in Warren earn Less than $10,000.
10.0% of households in Warren earn $10,000 to $14,999.
13.6% of households in Warren earn $15,000 to $24,999.
12.3% of households in Warren earn $25,000 to $34,999.
12.0% of households in Warren earn $35,000 to $49,999.
18.7% of households in Warren earn $50,000 to $74,999.
8.5% of households in Warren earn $75,000 to $99,999.
10.6% of households in Warren earn $100,000 to $149,999.
1.6% of households in Warren earn $150,000 to $199,999.
1.4% of households in Warren earn $200,000 or more.
| Income | Warren | OH | USA |
|---|---|---|---|
| Less than $10,000 | 11.4% | 5.2% | 5.0% |
| $10,000 to $14,999 | 10.0% | 4.0% | 3.4% |
| $15,000 to $24,999 | 13.6% | 7.1% | 6.3% |
| $25,000 to $34,999 | 12.3% | 7.5% | 6.6% |
| $35,000 to $49,999 | 12.0% | 11.6% | 10.1% |
| $50,000 to $74,999 | 18.7% | 16.9% | 15.5% |
| $75,000 to $99,999 | 8.5% | 13.1% | 12.6% |
| $100,000 to $149,999 | 10.6% | 17.1% | 17.5% |
| $150,000 to $199,999 | 1.6% | 8.3% | 9.6% |
| $200,000 or more | 1.4% | 9.1% | 13.4% |
Source: U.S. Census ACS 5-year estimates (2024)


