Bethlehem SnackAbility
Overall SnackAbility
Cost of living in Bethlehem summary. We use data on the cost of living to determine how expensive it is to live in Bethlehem. Real estate prices drive most of the variance in cost of living around Pennsylvania. Key points include:
The cost of living in Bethlehem is 100 with 100 being average.
The cost of living in Bethlehem is 1.0x lower than the national average.
The median home value in Bethlehem is $351,352.
The median income in Bethlehem is $68,879.
Bethlehem's Overall Cost Of Living
Lower Than The National Average
Cost Of Living In Bethlehem Comparison Table
| Living Expense | Bethlehem | Pennsylvania | National Average |
|---|---|---|---|
| Overall | 100 | 97 | 100 |
| Services | 100 | 99 | 100 |
| Groceries | 96 | 100 | 100 |
| Health | 103 | 88 | 100 |
| Housing | 101 | 102 | 100 |
| Transportation | 97 | 100 | 100 |
| Utilities | 98 | 101 | 100 |
Source: Cost of living index, normalized to US average = 100
Bethlehem, PA Weather
The average high in Bethlehem is 61.8° and the average low is 41.6°.
There are 79.0 days of precipitation each year.
Expect an average of 44.5 inches of precipitation each year with 33.8 inches of snow.
| Stat | Bethlehem |
|---|---|
| Average Annual High | 61.8 |
| Average Annual Low | 41.6 |
| Annual Precipitation Days | 79.0 |
| Average Annual Precipitation | 44.5 |
| Average Annual Snowfall | 33.8 |
Average High
Days of Rain
Source: NOAA climate normals (30-year)
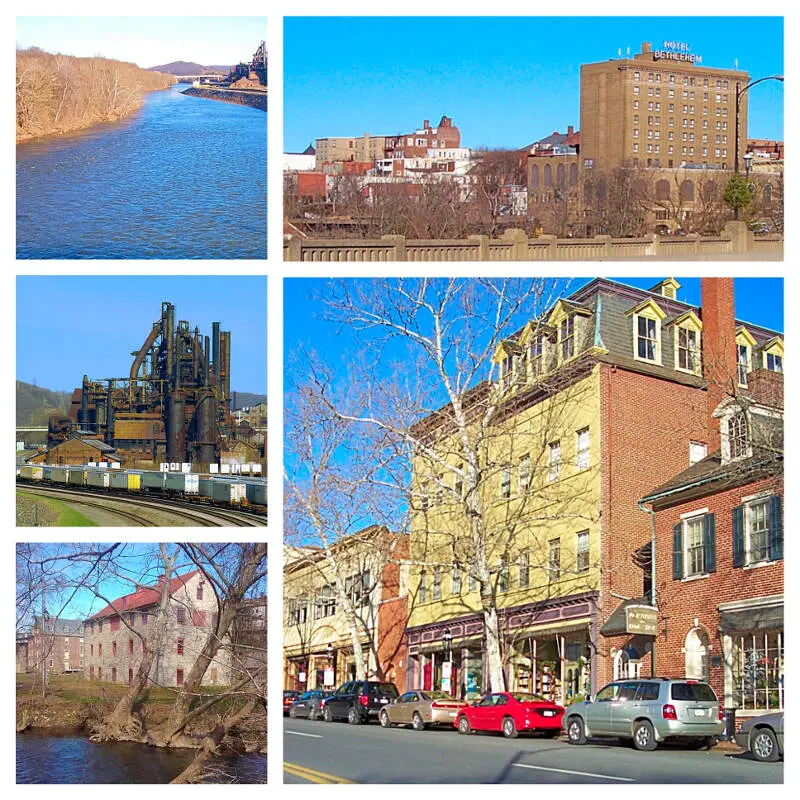
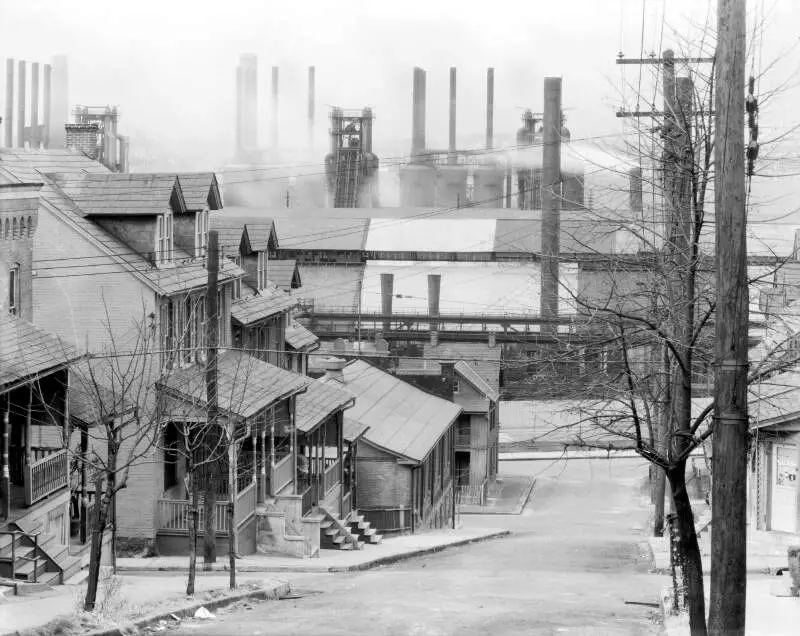
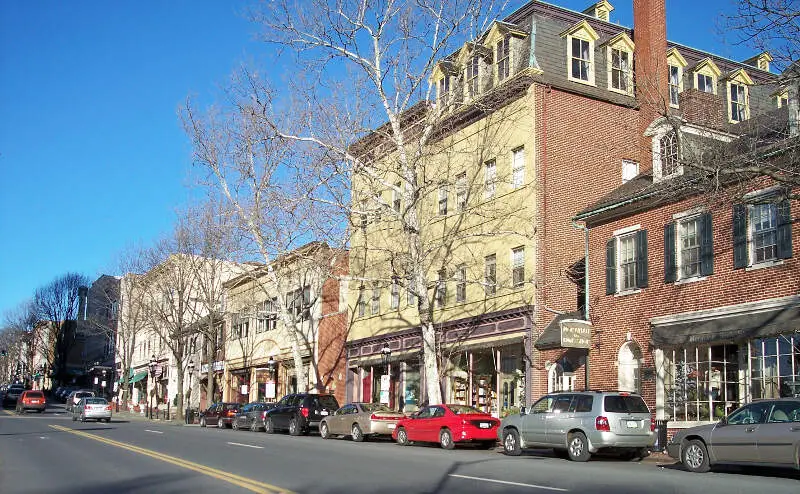
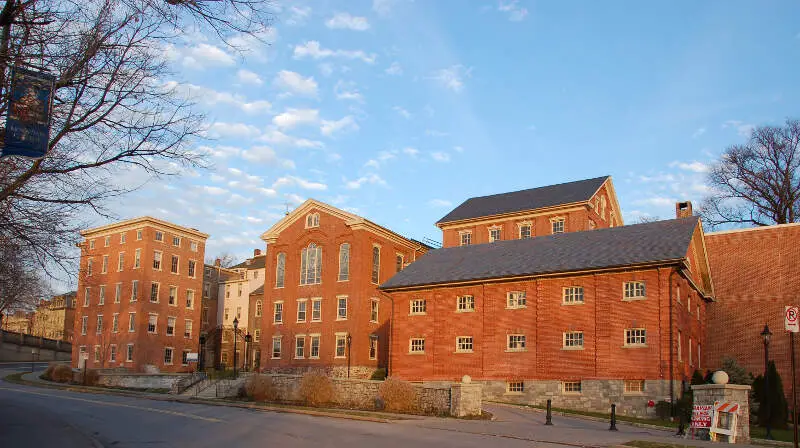
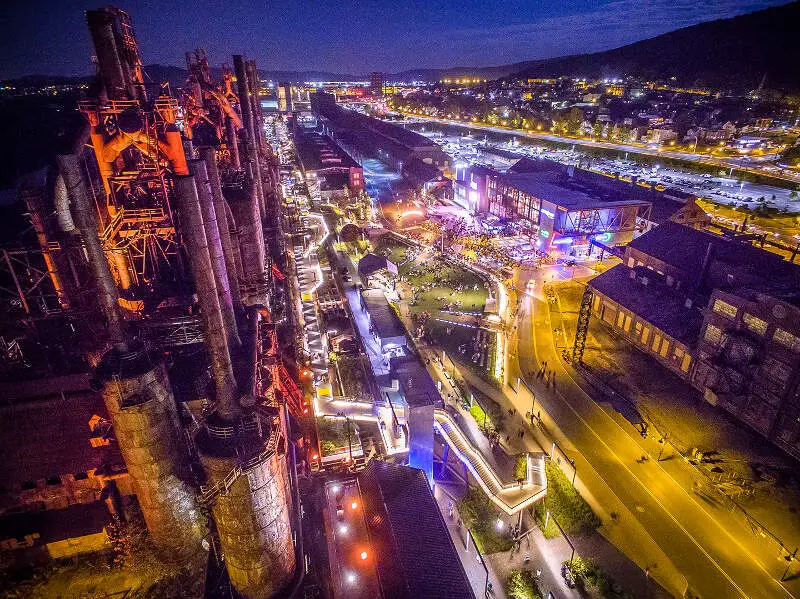
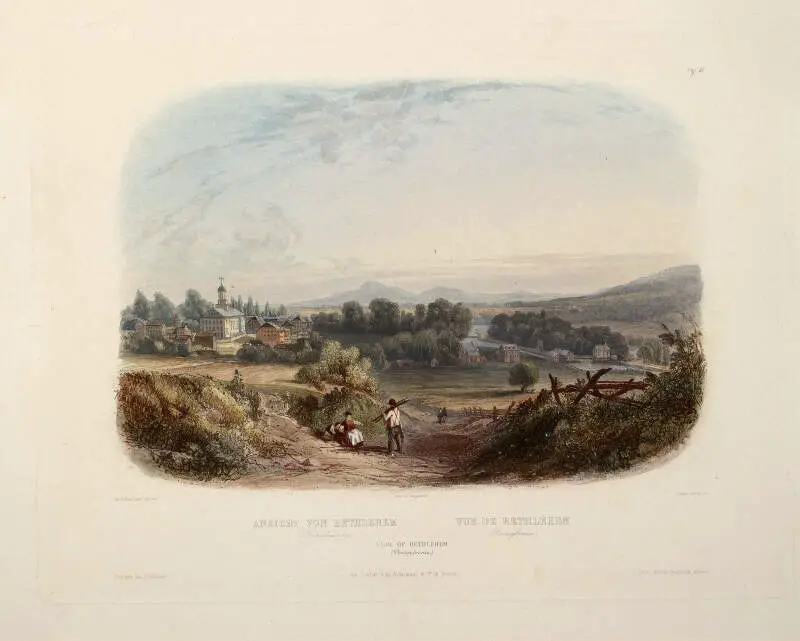
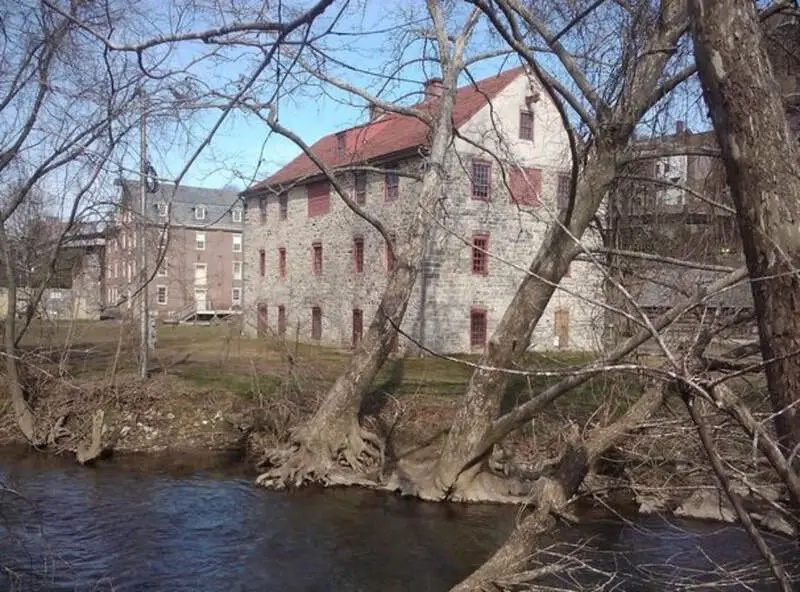
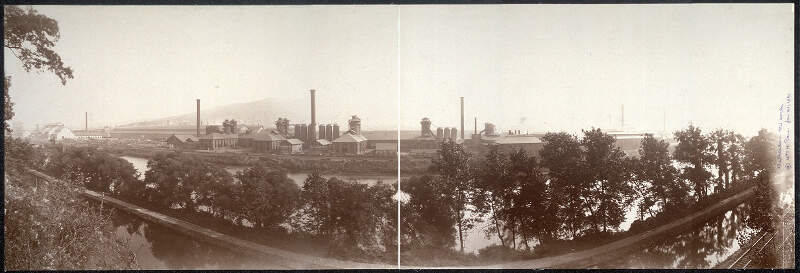
Bethlehem, PA Photos
Rankings & Articles For Bethlehem


Locations Around Bethlehem
Map Of Bethlehem, PA
Best Places Around Bethlehem
Ancient Oaks, PA
Population 7,777
Middletown, PA
Population 7,628
Middletown, PA
Population 7,628
Wescosville, PA
Population 7,148
Catasauqua, PA
Population 6,541
Perkasie, PA
Population 9,216
Emmaus, PA
Population 11,889
Northampton, PA
Population 10,400
Fullerton, PA
Population 16,724
Nazareth, PA
Population 6,043
Bethlehem Demographics And Statistics
Population over time in Bethlehem
The current population in Bethlehem is 77,956. The population has increased 4.3% from 2010.
| Year | Population | % Change |
|---|---|---|
| 2024 | 77,956 | 1.2% |
| 2023 | 77,069 | 0.7% |
| 2022 | 76,555 | 1.3% |
| 2021 | 75,599 | 0.0% |
| 2020 | 75,571 | 0.1% |
| 2019 | 75,461 | 0.2% |
| 2018 | 75,296 | 0.1% |
| 2017 | 75,240 | 0.2% |
| 2016 | 75,110 | 0.1% |
| 2015 | 75,004 | -0.1% |
| 2014 | 75,050 | 0.0% |
| 2013 | 75,030 | 0.0% |
| 2012 | 75,016 | 0.1% |
| 2011 | 74,965 | 0.3% |
| 2010 | 74,752 | - |
Race / Ethnicity in Bethlehem
See the full breakdown
Bethlehem is:
56.1% White with 43,762 White residents.
8.2% African American with 6,401 African American residents.
0.0% American Indian with 24 American Indian residents.
2.8% Asian with 2,177 Asian residents.
0.0% Hawaiian with 30 Hawaiian residents.
0.5% Other with 374 Other residents.
3.6% Two Or More with 2,797 Two Or More residents.
28.7% Hispanic with 22,391 Hispanic residents.
| Race | Bethlehem | PA | USA |
|---|---|---|---|
| White | 56.1% | 73.0% | 57.4% |
| African American | 8.2% | 10.3% | 11.9% |
| American Indian | 0.0% | 0.1% | 0.5% |
| Asian | 2.8% | 3.8% | 5.9% |
| Hawaiian | 0.0% | 0.0% | 0.2% |
| Other | 0.5% | 0.5% | 0.6% |
| Two Or More | 3.6% | 3.6% | 4.3% |
| Hispanic | 28.7% | 8.7% | 19.3% |
Gender in Bethlehem
See the full breakdown
Bethlehem is 51.7% female with 40,318 female residents.
Bethlehem is 48.3% male with 37,638 male residents.
| Gender | Bethlehem | PA | USA |
|---|---|---|---|
| Female | 51.7% | 50.7% | 50.5% |
| Male | 48.3% | 49.3% | 49.5% |
Highest level of educational attainment in Bethlehem for adults over 25
See the full breakdown
3.0% of adults in Bethlehem completed < 9th grade.
6.0% of adults in Bethlehem completed 9-12th grade.
28.0% of adults in Bethlehem completed high school / ged.
17.0% of adults in Bethlehem completed some college.
10.0% of adults in Bethlehem completed associate's degree.
21.0% of adults in Bethlehem completed bachelor's degree.
10.0% of adults in Bethlehem completed master's degree.
2.0% of adults in Bethlehem completed professional degree.
3.0% of adults in Bethlehem completed doctorate degree.
| Education | Bethlehem | PA | USA |
|---|---|---|---|
| < 9th Grade | 3.0% | 3.0% | 4.0% |
| 9-12th Grade | 6.0% | 5.0% | 6.0% |
| High School / GED | 28.0% | 33.0% | 26.0% |
| Some College | 17.0% | 15.0% | 19.0% |
| Associate's Degree | 10.0% | 9.0% | 9.0% |
| Bachelor's Degree | 21.0% | 21.0% | 22.0% |
| Master's Degree | 10.0% | 10.0% | 10.0% |
| Professional Degree | 2.0% | 2.0% | 2.0% |
| Doctorate Degree | 3.0% | 2.0% | 2.0% |
Household Income For Bethlehem, Pennsylvania
See the full breakdown
4.4% of households in Bethlehem earn Less than $10,000.
4.3% of households in Bethlehem earn $10,000 to $14,999.
8.2% of households in Bethlehem earn $15,000 to $24,999.
7.3% of households in Bethlehem earn $25,000 to $34,999.
12.8% of households in Bethlehem earn $35,000 to $49,999.
16.5% of households in Bethlehem earn $50,000 to $74,999.
13.1% of households in Bethlehem earn $75,000 to $99,999.
17.5% of households in Bethlehem earn $100,000 to $149,999.
8.4% of households in Bethlehem earn $150,000 to $199,999.
7.4% of households in Bethlehem earn $200,000 or more.
| Income | Bethlehem | PA | USA |
|---|---|---|---|
| Less than $10,000 | 4.4% | 4.9% | 5.0% |
| $10,000 to $14,999 | 4.3% | 3.5% | 3.4% |
| $15,000 to $24,999 | 8.2% | 6.7% | 6.3% |
| $25,000 to $34,999 | 7.3% | 6.9% | 6.6% |
| $35,000 to $49,999 | 12.8% | 10.5% | 10.1% |
| $50,000 to $74,999 | 16.5% | 15.9% | 15.5% |
| $75,000 to $99,999 | 13.1% | 12.8% | 12.6% |
| $100,000 to $149,999 | 17.5% | 17.7% | 17.5% |
| $150,000 to $199,999 | 8.4% | 9.3% | 9.6% |
| $200,000 or more | 7.4% | 11.8% | 13.4% |
Source: U.S. Census ACS 5-year estimates (2024)


