Northampton SnackAbility
Overall SnackAbility
Cost of living in Northampton summary. We use data on the cost of living to determine how expensive it is to live in Northampton. Real estate prices drive most of the variance in cost of living around Pennsylvania. Key points include:
The cost of living in Northampton is 101 with 100 being average.
The cost of living in Northampton is 1.0x higher than the national average.
The median home value in Northampton is $345,140.
The median income in Northampton is $90,762.
Northampton's Overall Cost Of Living
Higher Than The National Average
Cost Of Living In Northampton Comparison Table
| Living Expense | Northampton | Pennsylvania | National Average |
|---|---|---|---|
| Overall | 101 | 97 | 100 |
| Services | 100 | 99 | 100 |
| Groceries | 103 | 100 | 100 |
| Health | 99 | 88 | 100 |
| Housing | 106 | 102 | 100 |
| Transportation | 99 | 100 | 100 |
| Utilities | 101 | 101 | 100 |
Source: Cost of living index, normalized to US average = 100
Northampton, PA Weather
The average high in Northampton is 61.5° and the average low is 41.0°.
There are 78.1 days of precipitation each year.
Expect an average of 45.9 inches of precipitation each year with 31.9 inches of snow.
| Stat | Northampton |
|---|---|
| Average Annual High | 61.5 |
| Average Annual Low | 41.0 |
| Annual Precipitation Days | 78.1 |
| Average Annual Precipitation | 45.9 |
| Average Annual Snowfall | 31.9 |
Average High
Days of Rain
Source: NOAA climate normals (30-year)
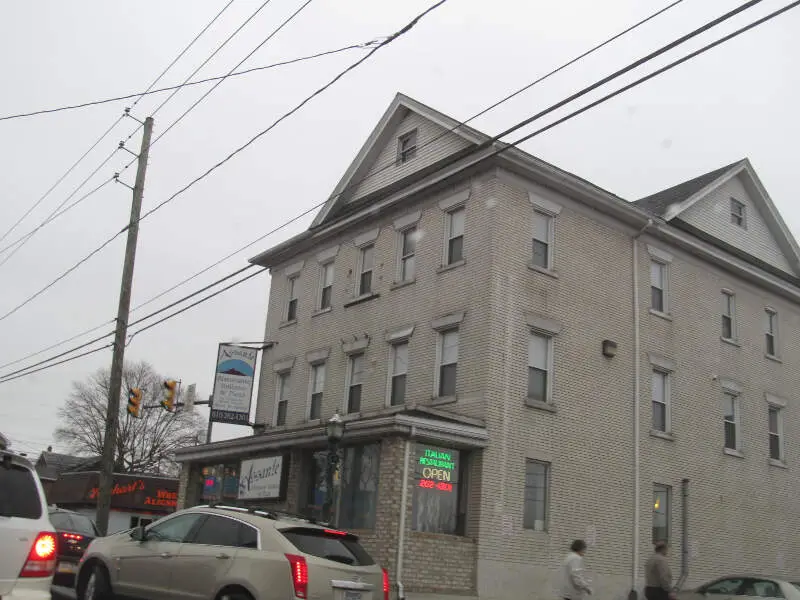
Northampton, PA Photos
Rankings & Articles For Northampton


Locations Around Northampton
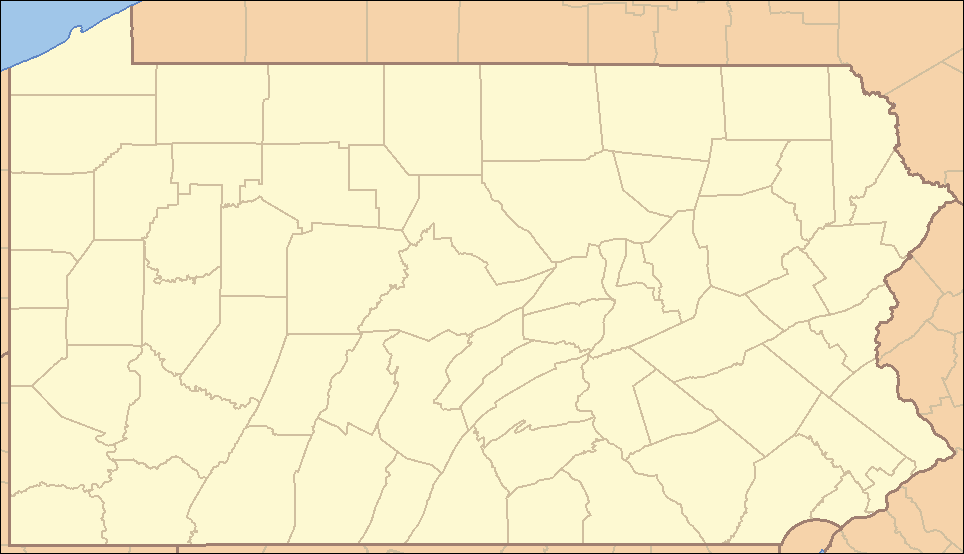
Map Of Northampton, PA
Best Places Around Northampton
Ancient Oaks, PA
Population 7,777
Middletown, PA
Population 7,628
Middletown, PA
Population 7,628
Wescosville, PA
Population 7,148
Catasauqua, PA
Population 6,541
Emmaus, PA
Population 11,889
Fullerton, PA
Population 16,724
Nazareth, PA
Population 6,043
Wilson, PA
Population 8,183
Bangor, PA
Population 5,163
Northampton Demographics And Statistics
Population over time in Northampton
The current population in Northampton is 10,400. The population has increased 4.9% from 2010.
| Year | Population | % Change |
|---|---|---|
| 2024 | 10,400 | 0.3% |
| 2023 | 10,366 | 0.2% |
| 2022 | 10,341 | 0.1% |
| 2021 | 10,328 | 4.7% |
| 2020 | 9,869 | 0.2% |
| 2019 | 9,847 | -0.3% |
| 2018 | 9,873 | -0.2% |
| 2017 | 9,888 | 0.0% |
| 2016 | 9,887 | -0.1% |
| 2015 | 9,895 | -0.3% |
| 2014 | 9,921 | -0.1% |
| 2013 | 9,933 | 0.0% |
| 2012 | 9,933 | 0.0% |
| 2011 | 9,931 | 0.1% |
| 2010 | 9,917 | - |
Race / Ethnicity in Northampton
See the full breakdown
Northampton is:
81.7% White with 8,496 White residents.
2.1% African American with 223 African American residents.
0.0% American Indian with 0 American Indian residents.
0.9% Asian with 96 Asian residents.
0.0% Hawaiian with 0 Hawaiian residents.
0.0% Other with 0 Other residents.
2.5% Two Or More with 265 Two Or More residents.
12.7% Hispanic with 1,320 Hispanic residents.
| Race | Northampton | PA | USA |
|---|---|---|---|
| White | 81.7% | 73.0% | 57.4% |
| African American | 2.1% | 10.3% | 11.9% |
| American Indian | 0.0% | 0.1% | 0.5% |
| Asian | 0.9% | 3.8% | 5.9% |
| Hawaiian | 0.0% | 0.0% | 0.2% |
| Other | 0.0% | 0.5% | 0.6% |
| Two Or More | 2.5% | 3.6% | 4.3% |
| Hispanic | 12.7% | 8.7% | 19.3% |
Gender in Northampton
See the full breakdown
Northampton is 49.6% female with 5,160 female residents.
Northampton is 50.4% male with 5,240 male residents.
| Gender | Northampton | PA | USA |
|---|---|---|---|
| Female | 49.6% | 50.7% | 50.5% |
| Male | 50.4% | 49.3% | 49.5% |
Highest level of educational attainment in Northampton for adults over 25
See the full breakdown
1.0% of adults in Northampton completed < 9th grade.
3.0% of adults in Northampton completed 9-12th grade.
39.0% of adults in Northampton completed high school / ged.
19.0% of adults in Northampton completed some college.
12.0% of adults in Northampton completed associate's degree.
17.0% of adults in Northampton completed bachelor's degree.
8.0% of adults in Northampton completed master's degree.
0.0% of adults in Northampton completed professional degree.
1.0% of adults in Northampton completed doctorate degree.
| Education | Northampton | PA | USA |
|---|---|---|---|
| < 9th Grade | 1.0% | 3.0% | 4.0% |
| 9-12th Grade | 3.0% | 5.0% | 6.0% |
| High School / GED | 39.0% | 33.0% | 26.0% |
| Some College | 19.0% | 15.0% | 19.0% |
| Associate's Degree | 12.0% | 9.0% | 9.0% |
| Bachelor's Degree | 17.0% | 21.0% | 22.0% |
| Master's Degree | 8.0% | 10.0% | 10.0% |
| Professional Degree | 0.0% | 2.0% | 2.0% |
| Doctorate Degree | 1.0% | 2.0% | 2.0% |
Household Income For Northampton, Pennsylvania
See the full breakdown
4.7% of households in Northampton earn Less than $10,000.
5.1% of households in Northampton earn $10,000 to $14,999.
1.0% of households in Northampton earn $15,000 to $24,999.
9.4% of households in Northampton earn $25,000 to $34,999.
8.0% of households in Northampton earn $35,000 to $49,999.
15.5% of households in Northampton earn $50,000 to $74,999.
12.2% of households in Northampton earn $75,000 to $99,999.
27.2% of households in Northampton earn $100,000 to $149,999.
12.3% of households in Northampton earn $150,000 to $199,999.
4.6% of households in Northampton earn $200,000 or more.
| Income | Northampton | PA | USA |
|---|---|---|---|
| Less than $10,000 | 4.7% | 4.9% | 5.0% |
| $10,000 to $14,999 | 5.1% | 3.5% | 3.4% |
| $15,000 to $24,999 | 1.0% | 6.7% | 6.3% |
| $25,000 to $34,999 | 9.4% | 6.9% | 6.6% |
| $35,000 to $49,999 | 8.0% | 10.5% | 10.1% |
| $50,000 to $74,999 | 15.5% | 15.9% | 15.5% |
| $75,000 to $99,999 | 12.2% | 12.8% | 12.6% |
| $100,000 to $149,999 | 27.2% | 17.7% | 17.5% |
| $150,000 to $199,999 | 12.3% | 9.3% | 9.6% |
| $200,000 or more | 4.6% | 11.8% | 13.4% |
Source: U.S. Census ACS 5-year estimates (2024)


