Blakely SnackAbility
Overall SnackAbility
Cost of living in Blakely summary. We use data on the cost of living to determine how expensive it is to live in Blakely. Real estate prices drive most of the variance in cost of living around Pennsylvania. Key points include:
The cost of living in Blakely is 95 with 100 being average.
The cost of living in Blakely is 0.9x lower than the national average.
The median home value in Blakely is $220,300.
The median income in Blakely is $55,855.
Blakely's Overall Cost Of Living
Lower Than The National Average
Cost Of Living In Blakely Comparison Table
| Living Expense | Blakely | Pennsylvania | National Average |
|---|---|---|---|
| Overall | 95 | 97 | 100 |
| Services | 102 | 99 | 100 |
| Groceries | 98 | 100 | 100 |
| Health | 87 | 88 | 100 |
| Housing | 95 | 102 | 100 |
| Transportation | 103 | 100 | 100 |
| Utilities | 101 | 101 | 100 |
Source: Cost of living index, normalized to US average = 100
Blakely, PA Weather
The average high in Blakely is 59.2° and the average low is 38.7°.
There are 93.4 days of precipitation each year.
Expect an average of 40.7 inches of precipitation each year with 60.8 inches of snow.
| Stat | Blakely |
|---|---|
| Average Annual High | 59.2 |
| Average Annual Low | 38.7 |
| Annual Precipitation Days | 93.4 |
| Average Annual Precipitation | 40.7 |
| Average Annual Snowfall | 60.8 |
Average High
Days of Rain
Source: NOAA climate normals (30-year)
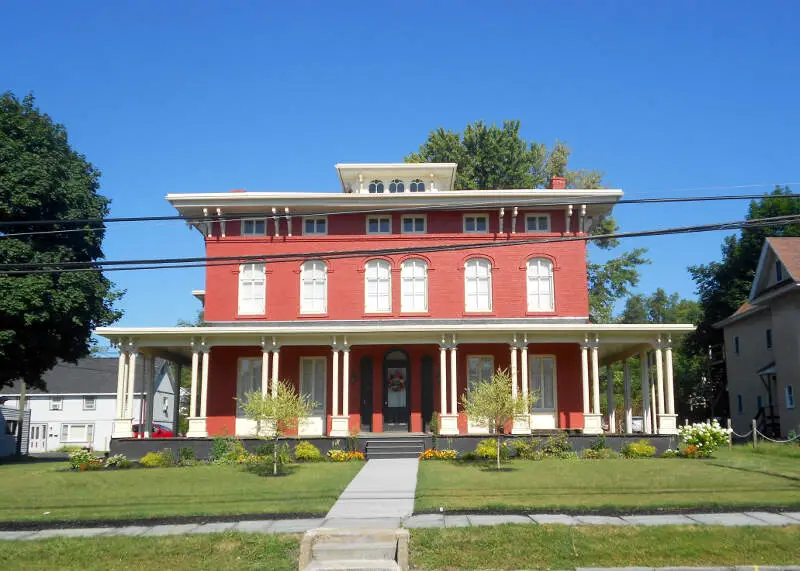
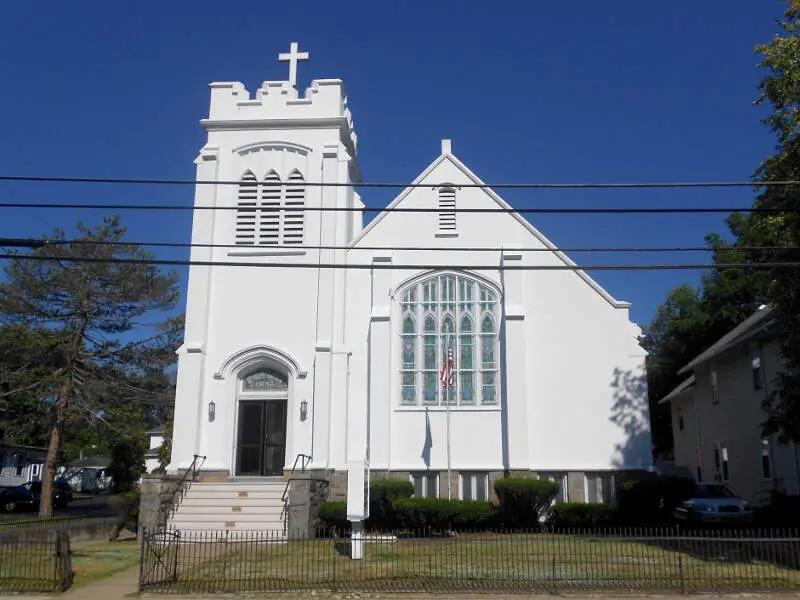
Blakely, PA Photos
Rankings & Articles For Blakely


Locations Around Blakely
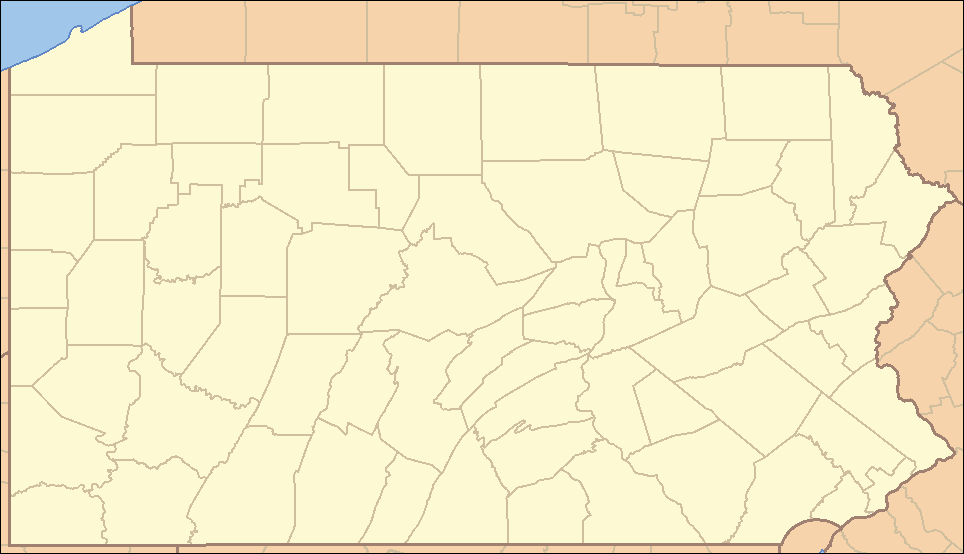
Map Of Blakely, PA
Best Places Around Blakely
Clarks Summit, PA
Population 5,073
Old Forge, PA
Population 8,573
Olyphant, PA
Population 5,381
Dunmore, PA
Population 14,181
Dickson, TN
Population 16,424
Swoyersville, PA
Population 5,048
Taylor, PA
Population 6,265
Archbald, PA
Population 7,404
Exeter, PA
Population 5,541
Moosic, PA
Population 5,973
Blakely Demographics And Statistics
Population over time in Blakely
The current population in Blakely is 6,662. The population has increased 0.0% from 2010.
| Year | Population | % Change |
|---|---|---|
| 2024 | 6,662 | 0.0% |
| 2023 | 6,661 | 0.2% |
| 2022 | 6,646 | 0.1% |
| 2021 | 6,640 | 6.5% |
| 2020 | 6,234 | -0.4% |
| 2019 | 6,258 | -0.9% |
| 2018 | 6,316 | -0.9% |
| 2017 | 6,372 | -0.9% |
| 2016 | 6,430 | -1.0% |
| 2015 | 6,496 | -0.6% |
| 2014 | 6,534 | -0.4% |
| 2013 | 6,557 | -0.5% |
| 2012 | 6,587 | -0.5% |
| 2011 | 6,623 | -0.5% |
| 2010 | 6,659 | - |
Race / Ethnicity in Blakely
See the full breakdown
Blakely is:
94.3% White with 6,282 White residents.
1.0% African American with 67 African American residents.
0.3% American Indian with 18 American Indian residents.
0.1% Asian with 6 Asian residents.
0.0% Hawaiian with 0 Hawaiian residents.
0.0% Other with 0 Other residents.
3.1% Two Or More with 208 Two Or More residents.
1.2% Hispanic with 81 Hispanic residents.
| Race | Blakely | PA | USA |
|---|---|---|---|
| White | 94.3% | 73.0% | 57.4% |
| African American | 1.0% | 10.3% | 11.9% |
| American Indian | 0.3% | 0.1% | 0.5% |
| Asian | 0.1% | 3.8% | 5.9% |
| Hawaiian | 0.0% | 0.0% | 0.2% |
| Other | 0.0% | 0.5% | 0.6% |
| Two Or More | 3.1% | 3.6% | 4.3% |
| Hispanic | 1.2% | 8.7% | 19.3% |
Gender in Blakely
See the full breakdown
Blakely is 57.1% female with 3,802 female residents.
Blakely is 42.9% male with 2,859 male residents.
| Gender | Blakely | PA | USA |
|---|---|---|---|
| Female | 57.1% | 50.7% | 50.5% |
| Male | 42.9% | 49.3% | 49.5% |
Highest level of educational attainment in Blakely for adults over 25
See the full breakdown
2.0% of adults in Blakely completed < 9th grade.
6.0% of adults in Blakely completed 9-12th grade.
39.0% of adults in Blakely completed high school / ged.
16.0% of adults in Blakely completed some college.
10.0% of adults in Blakely completed associate's degree.
17.0% of adults in Blakely completed bachelor's degree.
7.0% of adults in Blakely completed master's degree.
2.0% of adults in Blakely completed professional degree.
1.0% of adults in Blakely completed doctorate degree.
| Education | Blakely | PA | USA |
|---|---|---|---|
| < 9th Grade | 2.0% | 3.0% | 4.0% |
| 9-12th Grade | 6.0% | 5.0% | 6.0% |
| High School / GED | 39.0% | 33.0% | 26.0% |
| Some College | 16.0% | 15.0% | 19.0% |
| Associate's Degree | 10.0% | 9.0% | 9.0% |
| Bachelor's Degree | 17.0% | 21.0% | 22.0% |
| Master's Degree | 7.0% | 10.0% | 10.0% |
| Professional Degree | 2.0% | 2.0% | 2.0% |
| Doctorate Degree | 1.0% | 2.0% | 2.0% |
Household Income For Blakely, Pennsylvania
See the full breakdown
4.0% of households in Blakely earn Less than $10,000.
3.9% of households in Blakely earn $10,000 to $14,999.
4.9% of households in Blakely earn $15,000 to $24,999.
15.7% of households in Blakely earn $25,000 to $34,999.
13.1% of households in Blakely earn $35,000 to $49,999.
24.7% of households in Blakely earn $50,000 to $74,999.
9.5% of households in Blakely earn $75,000 to $99,999.
15.6% of households in Blakely earn $100,000 to $149,999.
7.6% of households in Blakely earn $150,000 to $199,999.
0.9% of households in Blakely earn $200,000 or more.
| Income | Blakely | PA | USA |
|---|---|---|---|
| Less than $10,000 | 4.0% | 4.9% | 5.0% |
| $10,000 to $14,999 | 3.9% | 3.5% | 3.4% |
| $15,000 to $24,999 | 4.9% | 6.7% | 6.3% |
| $25,000 to $34,999 | 15.7% | 6.9% | 6.6% |
| $35,000 to $49,999 | 13.1% | 10.5% | 10.1% |
| $50,000 to $74,999 | 24.7% | 15.9% | 15.5% |
| $75,000 to $99,999 | 9.5% | 12.8% | 12.6% |
| $100,000 to $149,999 | 15.6% | 17.7% | 17.5% |
| $150,000 to $199,999 | 7.6% | 9.3% | 9.6% |
| $200,000 or more | 0.9% | 11.8% | 13.4% |
Source: U.S. Census ACS 5-year estimates (2024)


