Dickson SnackAbility
Overall SnackAbility
Crime in Dickson summary. We use data from the FBI to determine the crime rates in Dickson. Key points include:
There were 474 total crimes in Dickson in the last reporting year.
The overall crime rate per 100,000 people in Dickson is 2,791.5 / 100k people.
The violent crime rate per 100,000 people in Dickson is 465.3 / 100k people.
The property crime rate per 100,000 people in Dickson is 2,326.3 / 100k people.
Overall, crime in Dickson is 31.72% above the national average.
Total Crimes
Above National Average
Crime In Dickson Comparison Table
| Statistic | Count Raw |
Dickson / 100k People |
Tennessee / 100k People |
National / 100k People |
|---|---|---|---|---|
| Total Crimes Per 100K | 474 | 2,791.5 | 2,624.4 | 2,119.2 |
| Violent Crime | 79 | 465.3 | 592.3 | 359.0 |
| Murder | 1 | 5.9 | 7.9 | 5.0 |
| Robbery | 0 | 0.0 | 58.4 | 61.0 |
| Aggravated Assault | 70 | 412.2 | 488.6 | 256.0 |
| Property Crime | 395 | 2,326.3 | 2,032.1 | 1,760.0 |
| Burglary | 18 | 106.0 | 251.8 | 229.0 |
| Larceny | 339 | 1,996.5 | 1,443.6 | 1,272.0 |
| Car Theft | 38 | 223.8 | 336.7 | 259.0 |
Source: FBI Uniform Crime Reporting (2024)
Cost of living in Dickson summary. We use data on the cost of living to determine how expensive it is to live in Dickson. Real estate prices drive most of the variance in cost of living around Tennessee. Key points include:
The cost of living in Dickson is 95 with 100 being average.
The cost of living in Dickson is 0.9x lower than the national average.
The median home value in Dickson is $344,966.
The median income in Dickson is $69,678.
Dickson's Overall Cost Of Living
Lower Than The National Average
Cost Of Living In Dickson Comparison Table
| Living Expense | Dickson | Tennessee | National Average |
|---|---|---|---|
| Overall | 95 | 94 | 100 |
| Services | 95 | 99 | 100 |
| Groceries | 98 | 96 | 100 |
| Health | 88 | 82 | 100 |
| Housing | 100 | 95 | 100 |
| Transportation | 99 | 99 | 100 |
| Utilities | 90 | 98 | 100 |
Source: Cost of living index, normalized to US average = 100
Dickson, TN Weather
The average high in Dickson is 68.8° and the average low is 47.0°.
There are 79.7 days of precipitation each year.
Expect an average of 53.8 inches of precipitation each year with 2.8 inches of snow.
| Stat | Dickson |
|---|---|
| Average Annual High | 68.8 |
| Average Annual Low | 47.0 |
| Annual Precipitation Days | 79.7 |
| Average Annual Precipitation | 53.8 |
| Average Annual Snowfall | 2.8 |
Average High
Days of Rain
Source: NOAA climate normals (30-year)
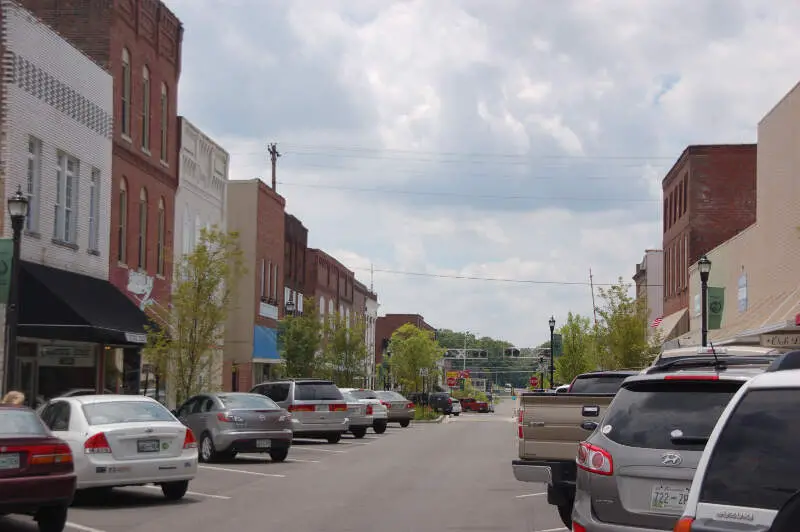
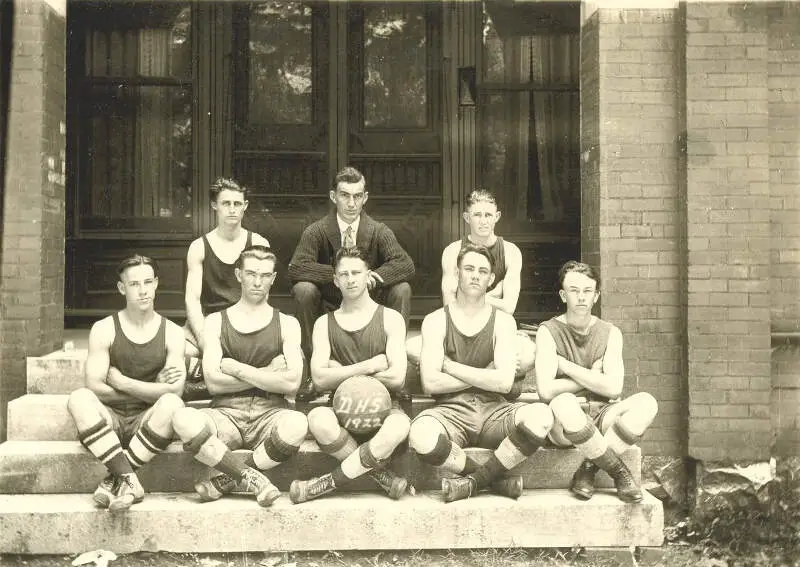
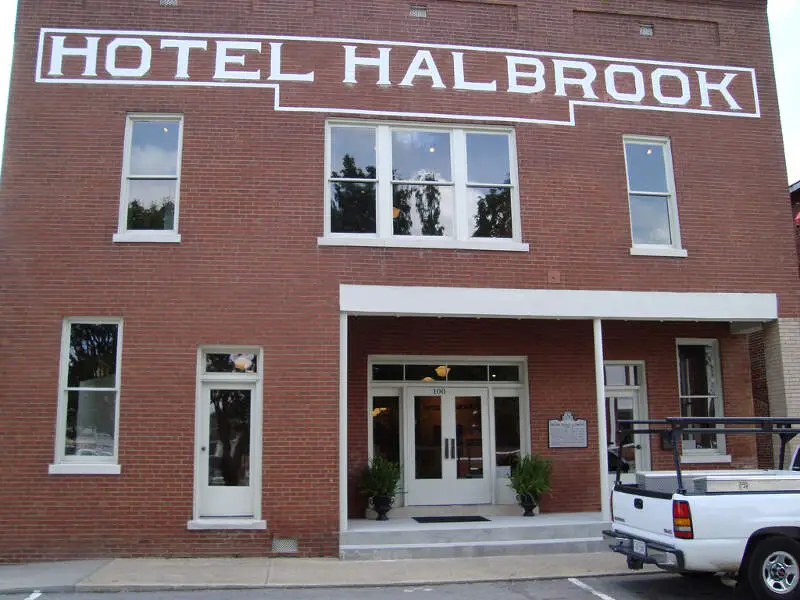
Dickson, TN Photos
Rankings & Articles For Dickson


Locations Around Dickson
Map Of Dickson, TN
Best Places Around Dickson
Clarks Summit, PA
Population 5,073
Old Forge, PA
Population 8,573
Kingston, PA
Population 13,397
Blakely, PA
Population 6,662
Olyphant, PA
Population 5,381
Dunmore, PA
Population 14,181
Swoyersville, PA
Population 5,048
Taylor, PA
Population 6,265
Archbald, PA
Population 7,404
Exeter, PA
Population 5,541
Dickson Demographics And Statistics
Population over time in Dickson
The current population in Dickson is 16,424. The population has increased 14.9% from 2010.
| Year | Population | % Change |
|---|---|---|
| 2024 | 16,424 | 1.1% |
| 2023 | 16,246 | 1.2% |
| 2022 | 16,051 | 1.2% |
| 2021 | 15,855 | 2.3% |
| 2020 | 15,500 | 0.3% |
| 2019 | 15,447 | 1.0% |
| 2018 | 15,294 | 1.1% |
| 2017 | 15,128 | 0.2% |
| 2016 | 15,098 | 1.0% |
| 2015 | 14,951 | 0.9% |
| 2014 | 14,814 | 0.4% |
| 2013 | 14,761 | 0.9% |
| 2012 | 14,629 | 1.3% |
| 2011 | 14,435 | 1.0% |
| 2010 | 14,299 | - |
Race / Ethnicity in Dickson
See the full breakdown
Dickson is:
79.0% White with 12,973 White residents.
6.1% African American with 999 African American residents.
0.1% American Indian with 21 American Indian residents.
0.2% Asian with 40 Asian residents.
0.0% Hawaiian with 0 Hawaiian residents.
0.8% Other with 130 Other residents.
4.5% Two Or More with 747 Two Or More residents.
9.2% Hispanic with 1,514 Hispanic residents.
| Race | Dickson | TN | USA |
|---|---|---|---|
| White | 79.0% | 71.0% | 57.4% |
| African American | 6.1% | 15.4% | 11.9% |
| American Indian | 0.1% | 0.1% | 0.5% |
| Asian | 0.2% | 1.9% | 5.9% |
| Hawaiian | 0.0% | 0.1% | 0.2% |
| Other | 0.8% | 0.4% | 0.6% |
| Two Or More | 4.5% | 3.7% | 4.3% |
| Hispanic | 9.2% | 7.4% | 19.3% |
Gender in Dickson
See the full breakdown
Dickson is 49.5% female with 8,122 female residents.
Dickson is 50.5% male with 8,302 male residents.
| Gender | Dickson | TN | USA |
|---|---|---|---|
| Female | 49.5% | 50.9% | 50.5% |
| Male | 50.5% | 49.1% | 49.5% |
Highest level of educational attainment in Dickson for adults over 25
See the full breakdown
4.0% of adults in Dickson completed < 9th grade.
6.0% of adults in Dickson completed 9-12th grade.
37.0% of adults in Dickson completed high school / ged.
25.0% of adults in Dickson completed some college.
10.0% of adults in Dickson completed associate's degree.
12.0% of adults in Dickson completed bachelor's degree.
5.0% of adults in Dickson completed master's degree.
0.0% of adults in Dickson completed professional degree.
1.0% of adults in Dickson completed doctorate degree.
| Education | Dickson | TN | USA |
|---|---|---|---|
| < 9th Grade | 4.0% | 4.0% | 4.0% |
| 9-12th Grade | 6.0% | 6.0% | 6.0% |
| High School / GED | 37.0% | 31.0% | 26.0% |
| Some College | 25.0% | 20.0% | 19.0% |
| Associate's Degree | 10.0% | 8.0% | 9.0% |
| Bachelor's Degree | 12.0% | 19.0% | 22.0% |
| Master's Degree | 5.0% | 8.0% | 10.0% |
| Professional Degree | 0.0% | 2.0% | 2.0% |
| Doctorate Degree | 1.0% | 2.0% | 2.0% |
Household Income For Dickson, Tennessee
See the full breakdown
4.9% of households in Dickson earn Less than $10,000.
2.5% of households in Dickson earn $10,000 to $14,999.
8.3% of households in Dickson earn $15,000 to $24,999.
6.6% of households in Dickson earn $25,000 to $34,999.
7.4% of households in Dickson earn $35,000 to $49,999.
26.7% of households in Dickson earn $50,000 to $74,999.
16.1% of households in Dickson earn $75,000 to $99,999.
14.9% of households in Dickson earn $100,000 to $149,999.
7.7% of households in Dickson earn $150,000 to $199,999.
4.8% of households in Dickson earn $200,000 or more.
| Income | Dickson | TN | USA |
|---|---|---|---|
| Less than $10,000 | 4.9% | 5.2% | 5.0% |
| $10,000 to $14,999 | 2.5% | 4.0% | 3.4% |
| $15,000 to $24,999 | 8.3% | 7.4% | 6.3% |
| $25,000 to $34,999 | 6.6% | 7.4% | 6.6% |
| $35,000 to $49,999 | 7.4% | 12.0% | 10.1% |
| $50,000 to $74,999 | 26.7% | 17.3% | 15.5% |
| $75,000 to $99,999 | 16.1% | 13.2% | 12.6% |
| $100,000 to $149,999 | 14.9% | 16.8% | 17.5% |
| $150,000 to $199,999 | 7.7% | 7.7% | 9.6% |
| $200,000 or more | 4.8% | 9.0% | 13.4% |
Source: U.S. Census ACS 5-year estimates (2024)


