Hanover SnackAbility
Overall SnackAbility
Crime in Hanover summary. We use data from the FBI to determine the crime rates in Hanover. Key points include:
There were 435 total crimes in Hanover in the last reporting year.
The overall crime rate per 100,000 people in Hanover is 2,618.0 / 100k people.
The violent crime rate per 100,000 people in Hanover is 108.3 / 100k people.
The property crime rate per 100,000 people in Hanover is 2,509.6 / 100k people.
Overall, crime in Hanover is 23.53% above the national average.
Total Crimes
Above National Average
Crime In Hanover Comparison Table
| Statistic | Count Raw |
Hanover / 100k People |
Pennsylvania / 100k People |
National / 100k People |
|---|---|---|---|---|
| Total Crimes Per 100K | 435 | 2,618.0 | 1,680.6 | 2,119.2 |
| Violent Crime | 18 | 108.3 | 245.6 | 359.0 |
| Murder | 0 | 0.0 | 5.0 | 5.0 |
| Robbery | 1 | 6.0 | 51.4 | 61.0 |
| Aggravated Assault | 17 | 102.3 | 161.4 | 256.0 |
| Property Crime | 417 | 2,509.6 | 1,435.0 | 1,760.0 |
| Burglary | 8 | 48.1 | 116.7 | 229.0 |
| Larceny | 385 | 2,317.0 | 1,129.8 | 1,272.0 |
| Car Theft | 24 | 144.4 | 188.5 | 259.0 |
Source: FBI Uniform Crime Reporting (2024)
Cost of living in Hanover summary. We use data on the cost of living to determine how expensive it is to live in Hanover. Real estate prices drive most of the variance in cost of living around Pennsylvania. Key points include:
The cost of living in Hanover is 98 with 100 being average.
The cost of living in Hanover is 1.0x lower than the national average.
The median home value in Hanover is $291,772.
The median income in Hanover is $61,293.
Hanover's Overall Cost Of Living
Lower Than The National Average
Cost Of Living In Hanover Comparison Table
| Living Expense | Hanover | Pennsylvania | National Average |
|---|---|---|---|
| Overall | 98 | 97 | 100 |
| Services | 100 | 99 | 100 |
| Groceries | 102 | 100 | 100 |
| Health | 87 | 88 | 100 |
| Housing | 99 | 102 | 100 |
| Transportation | 99 | 100 | 100 |
| Utilities | 97 | 101 | 100 |
Source: Cost of living index, normalized to US average = 100
Hanover, PA Weather
The average high in Hanover is 62.9° and the average low is 42.5°.
There are 76.5 days of precipitation each year.
Expect an average of 43.2 inches of precipitation each year with 25.3 inches of snow.
| Stat | Hanover |
|---|---|
| Average Annual High | 62.9 |
| Average Annual Low | 42.5 |
| Annual Precipitation Days | 76.5 |
| Average Annual Precipitation | 43.2 |
| Average Annual Snowfall | 25.3 |
Average High
Days of Rain
Source: NOAA climate normals (30-year)
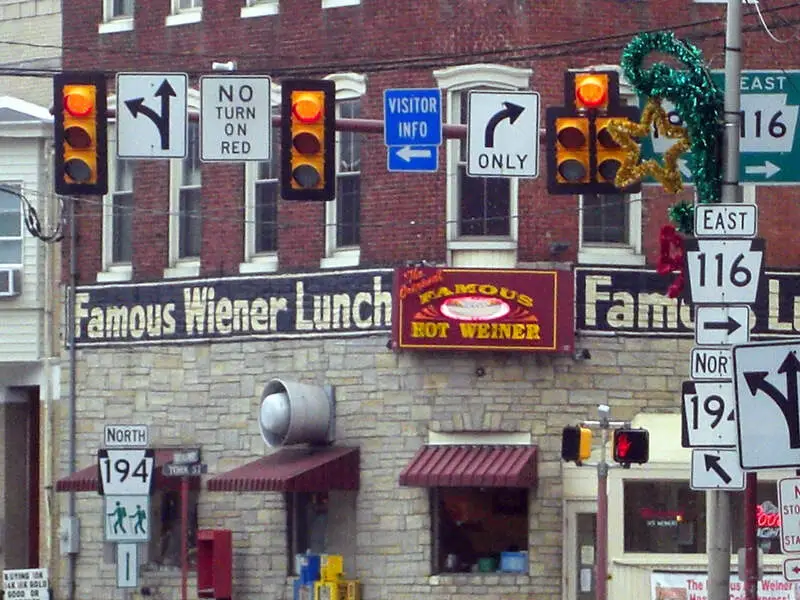
Hanover, PA Photos


Rankings & Articles For Hanover


Locations Around Hanover
Map Of Hanover, PA
Best Places Around Hanover
East York, PA
Population 9,388
Shiloh, PA
Population 11,246
Weigelstown, PA
Population 15,485
Parkville, PA
Population 8,128
Hampstead, MD
Population 6,251
Taneytown, MD
Population 7,932
Westminster, MD
Population 20,445
York, PA
Population 44,938
Hanover Demographics And Statistics
Population over time in Hanover
The current population in Hanover is 16,584. The population has increased 8.7% from 2010.
| Year | Population | % Change |
|---|---|---|
| 2024 | 16,584 | 0.6% |
| 2023 | 16,483 | 0.4% |
| 2022 | 16,411 | 0.7% |
| 2021 | 16,291 | 3.9% |
| 2020 | 15,675 | 0.4% |
| 2019 | 15,609 | 0.3% |
| 2018 | 15,563 | 0.4% |
| 2017 | 15,506 | 0.5% |
| 2016 | 15,429 | 0.2% |
| 2015 | 15,403 | 0.2% |
| 2014 | 15,365 | 0.2% |
| 2013 | 15,332 | 0.1% |
| 2012 | 15,315 | 0.1% |
| 2011 | 15,305 | 0.3% |
| 2010 | 15,256 | - |
Race / Ethnicity in Hanover
See the full breakdown
Hanover is:
78.0% White with 12,937 White residents.
3.4% African American with 557 African American residents.
0.0% American Indian with 0 American Indian residents.
1.5% Asian with 244 Asian residents.
0.1% Hawaiian with 13 Hawaiian residents.
0.2% Other with 29 Other residents.
4.2% Two Or More with 698 Two Or More residents.
12.7% Hispanic with 2,106 Hispanic residents.
| Race | Hanover | PA | USA |
|---|---|---|---|
| White | 78.0% | 73.0% | 57.4% |
| African American | 3.4% | 10.3% | 11.9% |
| American Indian | 0.0% | 0.1% | 0.5% |
| Asian | 1.5% | 3.8% | 5.9% |
| Hawaiian | 0.1% | 0.0% | 0.2% |
| Other | 0.2% | 0.5% | 0.6% |
| Two Or More | 4.2% | 3.6% | 4.3% |
| Hispanic | 12.7% | 8.7% | 19.3% |
Gender in Hanover
See the full breakdown
Hanover is 51.8% female with 8,589 female residents.
Hanover is 48.2% male with 7,994 male residents.
| Gender | Hanover | PA | USA |
|---|---|---|---|
| Female | 51.8% | 50.7% | 50.5% |
| Male | 48.2% | 49.3% | 49.5% |
Highest level of educational attainment in Hanover for adults over 25
See the full breakdown
4.0% of adults in Hanover completed < 9th grade.
8.0% of adults in Hanover completed 9-12th grade.
46.0% of adults in Hanover completed high school / ged.
19.0% of adults in Hanover completed some college.
8.0% of adults in Hanover completed associate's degree.
9.0% of adults in Hanover completed bachelor's degree.
5.0% of adults in Hanover completed master's degree.
1.0% of adults in Hanover completed professional degree.
0.0% of adults in Hanover completed doctorate degree.
| Education | Hanover | PA | USA |
|---|---|---|---|
| < 9th Grade | 4.0% | 3.0% | 4.0% |
| 9-12th Grade | 8.0% | 5.0% | 6.0% |
| High School / GED | 46.0% | 33.0% | 26.0% |
| Some College | 19.0% | 15.0% | 19.0% |
| Associate's Degree | 8.0% | 9.0% | 9.0% |
| Bachelor's Degree | 9.0% | 21.0% | 22.0% |
| Master's Degree | 5.0% | 10.0% | 10.0% |
| Professional Degree | 1.0% | 2.0% | 2.0% |
| Doctorate Degree | 0.0% | 2.0% | 2.0% |
Household Income For Hanover, Pennsylvania
See the full breakdown
4.1% of households in Hanover earn Less than $10,000.
3.5% of households in Hanover earn $10,000 to $14,999.
6.4% of households in Hanover earn $15,000 to $24,999.
11.5% of households in Hanover earn $25,000 to $34,999.
16.1% of households in Hanover earn $35,000 to $49,999.
19.4% of households in Hanover earn $50,000 to $74,999.
12.8% of households in Hanover earn $75,000 to $99,999.
17.1% of households in Hanover earn $100,000 to $149,999.
3.2% of households in Hanover earn $150,000 to $199,999.
5.8% of households in Hanover earn $200,000 or more.
| Income | Hanover | PA | USA |
|---|---|---|---|
| Less than $10,000 | 4.1% | 4.9% | 5.0% |
| $10,000 to $14,999 | 3.5% | 3.5% | 3.4% |
| $15,000 to $24,999 | 6.4% | 6.7% | 6.3% |
| $25,000 to $34,999 | 11.5% | 6.9% | 6.6% |
| $35,000 to $49,999 | 16.1% | 10.5% | 10.1% |
| $50,000 to $74,999 | 19.4% | 15.9% | 15.5% |
| $75,000 to $99,999 | 12.8% | 12.8% | 12.6% |
| $100,000 to $149,999 | 17.1% | 17.7% | 17.5% |
| $150,000 to $199,999 | 3.2% | 9.3% | 9.6% |
| $200,000 or more | 5.8% | 11.8% | 13.4% |
Source: U.S. Census ACS 5-year estimates (2024)


