Lehighton SnackAbility
Overall SnackAbility
Crime in Lehighton summary. We use data from the FBI to determine the crime rates in Lehighton. Key points include:
There were 69 total crimes in Lehighton in the last reporting year.
The overall crime rate per 100,000 people in Lehighton is 1,312.0 / 100k people.
The violent crime rate per 100,000 people in Lehighton is 152.1 / 100k people.
The property crime rate per 100,000 people in Lehighton is 1,159.9 / 100k people.
Overall, crime in Lehighton is -38.09% below the national average.
Total Crimes
Below National Average
Crime In Lehighton Comparison Table
| Statistic | Count Raw |
Lehighton / 100k People |
Pennsylvania / 100k People |
National / 100k People |
|---|---|---|---|---|
| Total Crimes Per 100K | 69 | 1,312.0 | 1,680.6 | 2,119.2 |
| Violent Crime | 8 | 152.1 | 245.6 | 359.0 |
| Murder | 0 | 0.0 | 5.0 | 5.0 |
| Robbery | 3 | 57.0 | 51.4 | 61.0 |
| Aggravated Assault | 2 | 38.0 | 161.4 | 256.0 |
| Property Crime | 61 | 1,159.9 | 1,435.0 | 1,760.0 |
| Burglary | 6 | 114.1 | 116.7 | 229.0 |
| Larceny | 50 | 950.8 | 1,129.8 | 1,272.0 |
| Car Theft | 5 | 95.1 | 188.5 | 259.0 |
Source: FBI Uniform Crime Reporting (2024)
Cost of living in Lehighton summary. We use data on the cost of living to determine how expensive it is to live in Lehighton. Real estate prices drive most of the variance in cost of living around Pennsylvania. Key points include:
The cost of living in Lehighton is 94 with 100 being average.
The cost of living in Lehighton is 0.9x lower than the national average.
The median home value in Lehighton is $277,946.
The median income in Lehighton is $64,651.
Lehighton's Overall Cost Of Living
Lower Than The National Average
Cost Of Living In Lehighton Comparison Table
| Living Expense | Lehighton | Pennsylvania | National Average |
|---|---|---|---|
| Overall | 94 | 97 | 100 |
| Services | 98 | 99 | 100 |
| Groceries | 101 | 100 | 100 |
| Health | 69 | 88 | 100 |
| Housing | 106 | 102 | 100 |
| Transportation | 96 | 100 | 100 |
| Utilities | 105 | 101 | 100 |
Source: Cost of living index, normalized to US average = 100
Lehighton, PA Weather
The average high in Lehighton is 61.0° and the average low is 39.7°.
There are 93.0 days of precipitation each year.
Expect an average of 48.6 inches of precipitation each year with 32.3 inches of snow.
| Stat | Lehighton |
|---|---|
| Average Annual High | 61.0 |
| Average Annual Low | 39.7 |
| Annual Precipitation Days | 93.0 |
| Average Annual Precipitation | 48.6 |
| Average Annual Snowfall | 32.3 |
Average High
Days of Rain
Source: NOAA climate normals (30-year)
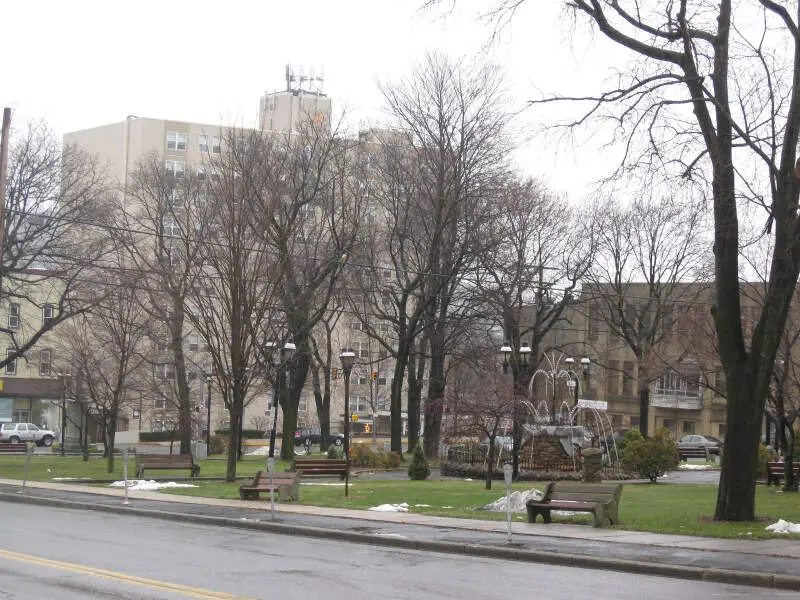
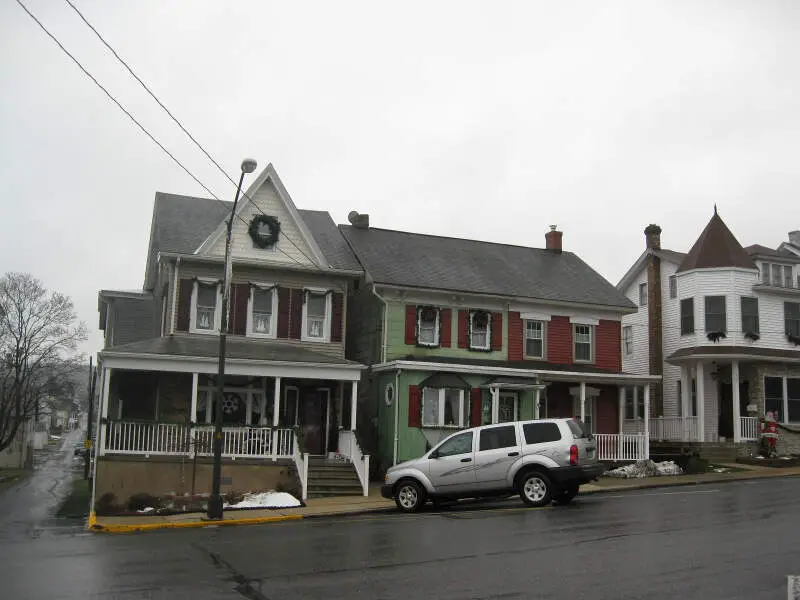
Lehighton, PA Photos
Rankings & Articles For Lehighton


Locations Around Lehighton
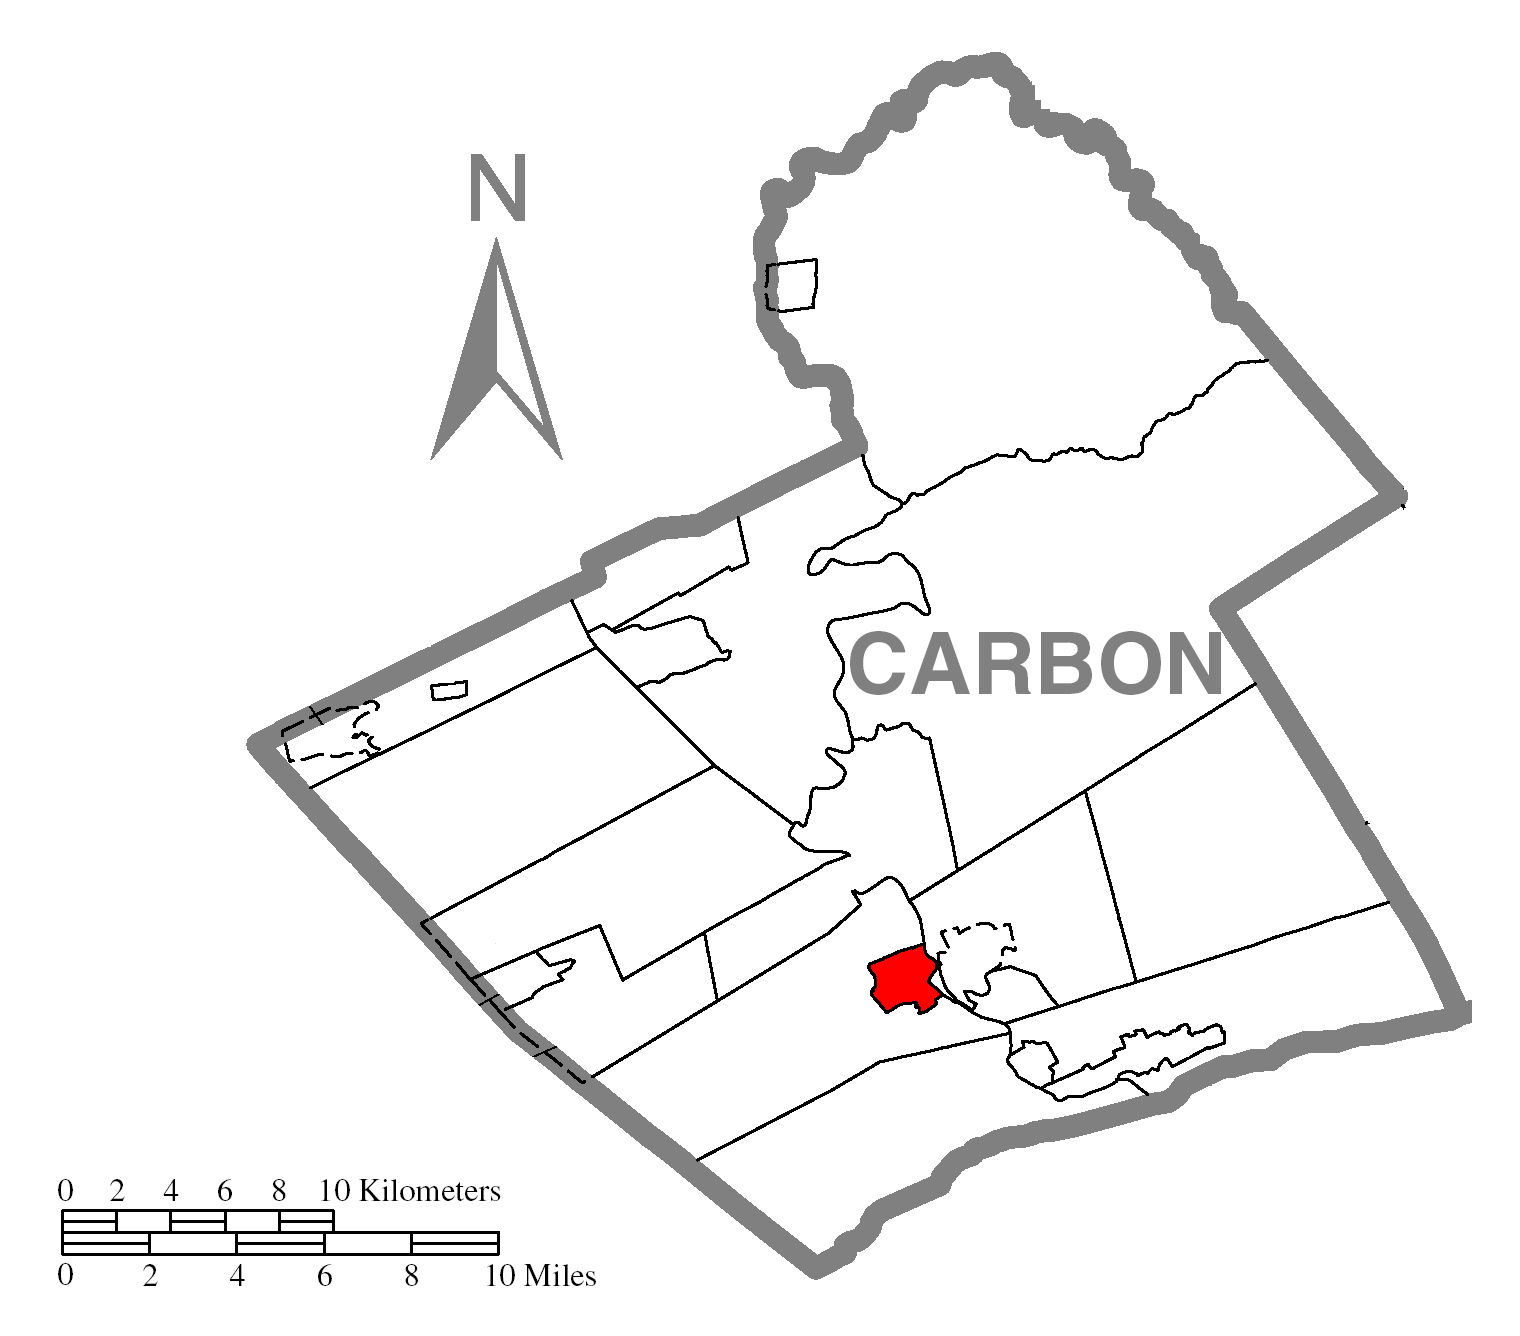
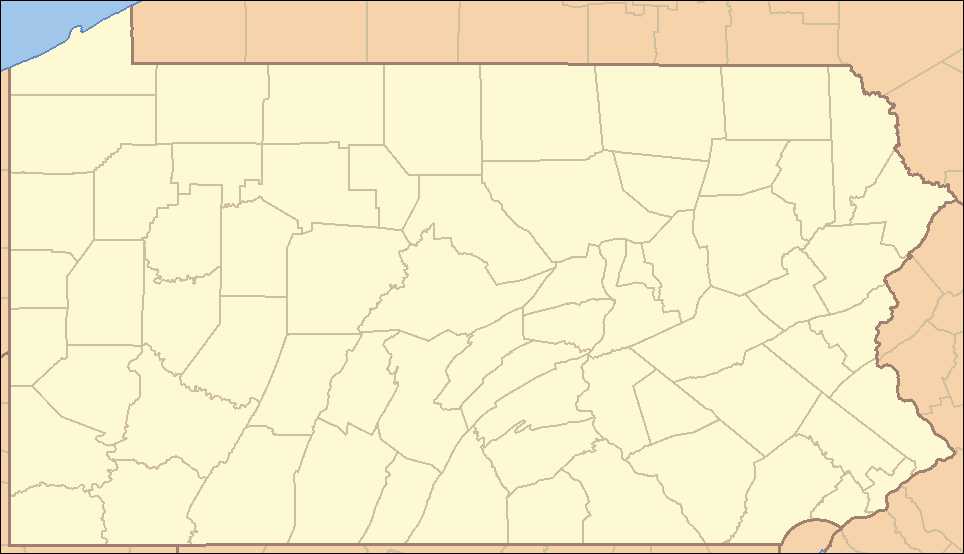
Map Of Lehighton, PA
Best Places Around Lehighton
Sierra View, PA
Population 6,365
Catasauqua, PA
Population 6,541
Northampton, PA
Population 10,400
Fullerton, PA
Population 16,724
Palmerton, PA
Population 5,622
Tamaqua, PA
Population 6,924
Hazleton, PA
Population 30,111
Lehighton Demographics And Statistics
Population over time in Lehighton
The current population in Lehighton is 5,268. The population has decreased 5.0% from 2010.
| Year | Population | % Change |
|---|---|---|
| 2024 | 5,268 | 0.0% |
| 2023 | 5,268 | -0.2% |
| 2022 | 5,279 | 0.2% |
| 2021 | 5,267 | -0.7% |
| 2020 | 5,305 | 0.0% |
| 2019 | 5,304 | -0.2% |
| 2018 | 5,313 | -0.4% |
| 2017 | 5,332 | -0.5% |
| 2016 | 5,360 | -0.5% |
| 2015 | 5,388 | -0.7% |
| 2014 | 5,427 | -0.8% |
| 2013 | 5,473 | -0.4% |
| 2012 | 5,495 | -0.7% |
| 2011 | 5,536 | -0.2% |
| 2010 | 5,548 | - |
Race / Ethnicity in Lehighton
See the full breakdown
Lehighton is:
91.9% White with 4,840 White residents.
0.0% African American with 0 African American residents.
0.0% American Indian with 0 American Indian residents.
1.2% Asian with 65 Asian residents.
0.0% Hawaiian with 0 Hawaiian residents.
0.0% Other with 0 Other residents.
3.2% Two Or More with 166 Two Or More residents.
3.7% Hispanic with 197 Hispanic residents.
| Race | Lehighton | PA | USA |
|---|---|---|---|
| White | 91.9% | 73.0% | 57.4% |
| African American | 0.0% | 10.3% | 11.9% |
| American Indian | 0.0% | 0.1% | 0.5% |
| Asian | 1.2% | 3.8% | 5.9% |
| Hawaiian | 0.0% | 0.0% | 0.2% |
| Other | 0.0% | 0.5% | 0.6% |
| Two Or More | 3.2% | 3.6% | 4.3% |
| Hispanic | 3.7% | 8.7% | 19.3% |
Gender in Lehighton
See the full breakdown
Lehighton is 53.7% female with 2,829 female residents.
Lehighton is 46.3% male with 2,438 male residents.
| Gender | Lehighton | PA | USA |
|---|---|---|---|
| Female | 53.7% | 50.7% | 50.5% |
| Male | 46.3% | 49.3% | 49.5% |
Highest level of educational attainment in Lehighton for adults over 25
See the full breakdown
3.0% of adults in Lehighton completed < 9th grade.
7.0% of adults in Lehighton completed 9-12th grade.
49.0% of adults in Lehighton completed high school / ged.
17.0% of adults in Lehighton completed some college.
10.0% of adults in Lehighton completed associate's degree.
7.0% of adults in Lehighton completed bachelor's degree.
2.0% of adults in Lehighton completed master's degree.
4.0% of adults in Lehighton completed professional degree.
1.0% of adults in Lehighton completed doctorate degree.
| Education | Lehighton | PA | USA |
|---|---|---|---|
| < 9th Grade | 3.0% | 3.0% | 4.0% |
| 9-12th Grade | 7.0% | 5.0% | 6.0% |
| High School / GED | 49.0% | 33.0% | 26.0% |
| Some College | 17.0% | 15.0% | 19.0% |
| Associate's Degree | 10.0% | 9.0% | 9.0% |
| Bachelor's Degree | 7.0% | 21.0% | 22.0% |
| Master's Degree | 2.0% | 10.0% | 10.0% |
| Professional Degree | 4.0% | 2.0% | 2.0% |
| Doctorate Degree | 1.0% | 2.0% | 2.0% |
Household Income For Lehighton, Pennsylvania
See the full breakdown
7.8% of households in Lehighton earn Less than $10,000.
3.8% of households in Lehighton earn $10,000 to $14,999.
8.4% of households in Lehighton earn $15,000 to $24,999.
5.6% of households in Lehighton earn $25,000 to $34,999.
12.7% of households in Lehighton earn $35,000 to $49,999.
14.0% of households in Lehighton earn $50,000 to $74,999.
13.7% of households in Lehighton earn $75,000 to $99,999.
18.1% of households in Lehighton earn $100,000 to $149,999.
11.0% of households in Lehighton earn $150,000 to $199,999.
5.0% of households in Lehighton earn $200,000 or more.
| Income | Lehighton | PA | USA |
|---|---|---|---|
| Less than $10,000 | 7.8% | 4.9% | 5.0% |
| $10,000 to $14,999 | 3.8% | 3.5% | 3.4% |
| $15,000 to $24,999 | 8.4% | 6.7% | 6.3% |
| $25,000 to $34,999 | 5.6% | 6.9% | 6.6% |
| $35,000 to $49,999 | 12.7% | 10.5% | 10.1% |
| $50,000 to $74,999 | 14.0% | 15.9% | 15.5% |
| $75,000 to $99,999 | 13.7% | 12.8% | 12.6% |
| $100,000 to $149,999 | 18.1% | 17.7% | 17.5% |
| $150,000 to $199,999 | 11.0% | 9.3% | 9.6% |
| $200,000 or more | 5.0% | 11.8% | 13.4% |
Source: U.S. Census ACS 5-year estimates (2024)


