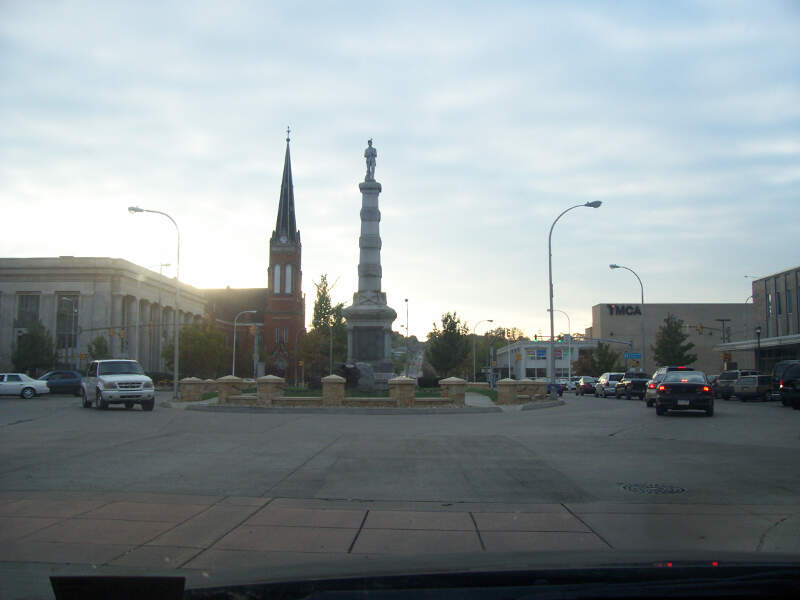
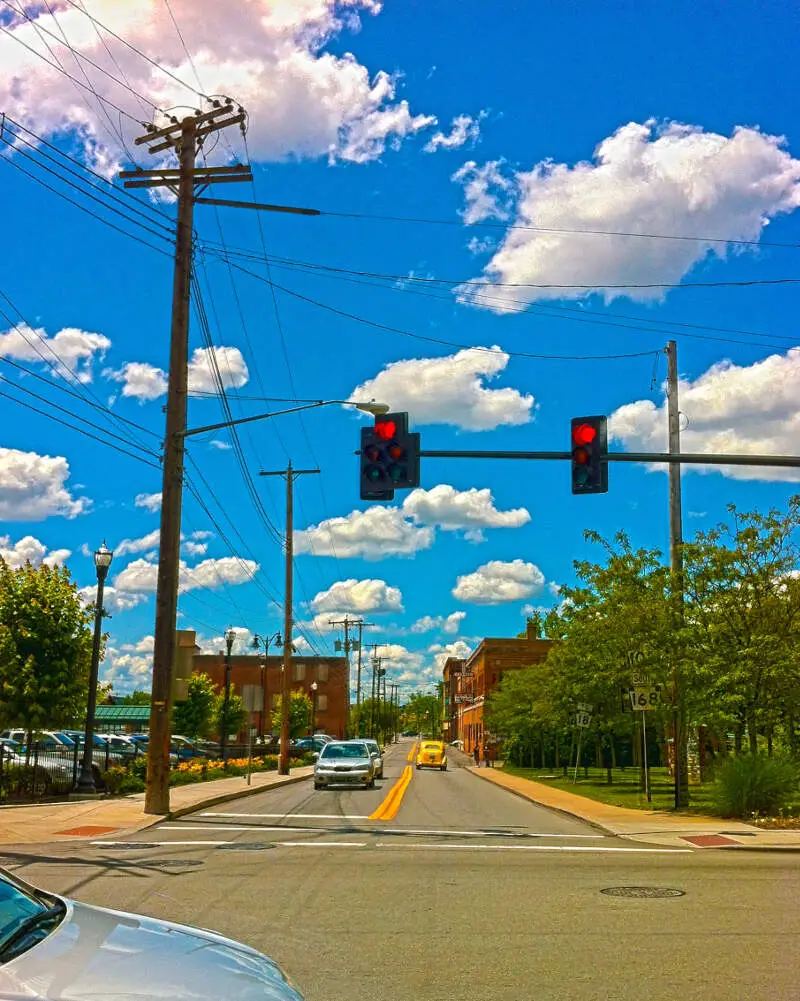
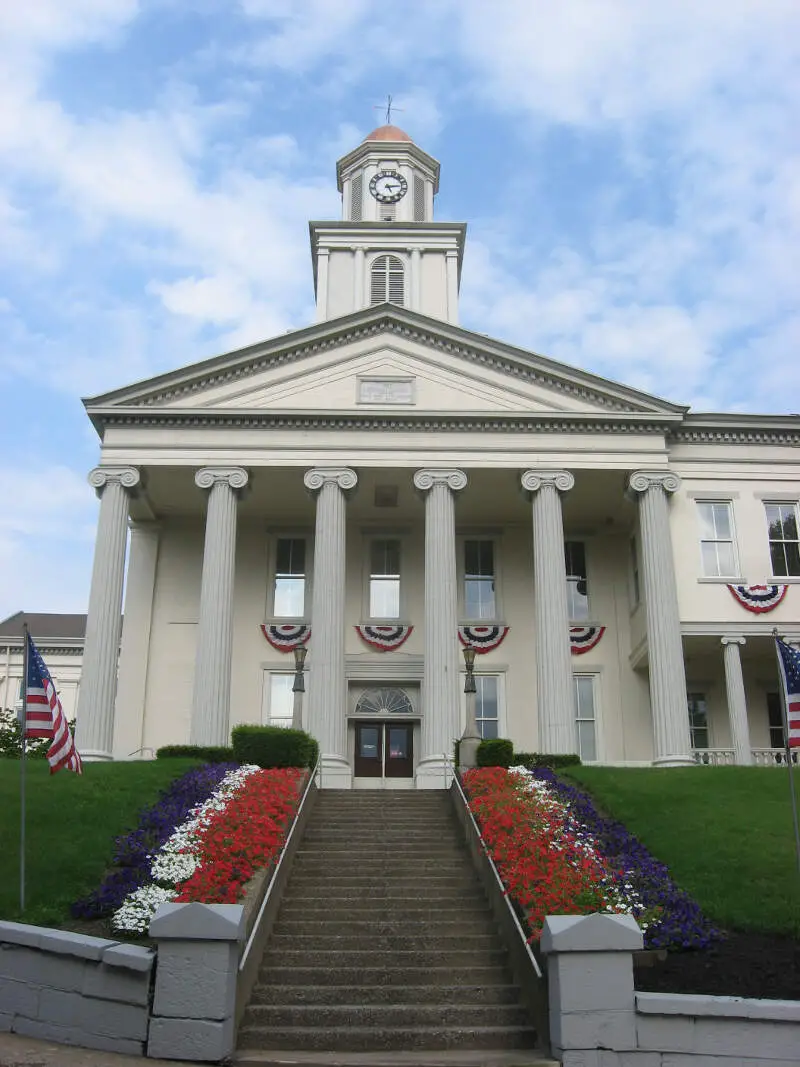
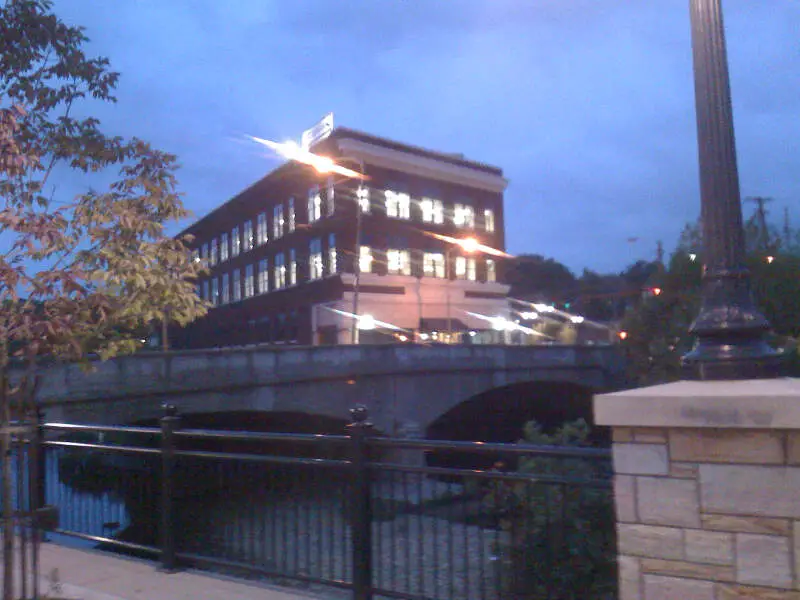
New Castle, PA
Demographics And Statistics
Living In New Castle, Pennsylvania Summary
Life in New Castle research summary. HomeSnacks has been using Saturday Night Science to research the quality of life in New Castle over the past nine years using Census, FBI, Zillow, and other primary data sources. Based on the most recently available data, we found the following about life in New Castle:
The population in New Castle is 21,727.
The median home value in New Castle is $139,068.
The median income in New Castle is $41,478.
The cost of living in New Castle is 84 which is 0.8x lower than the national average.
The median rent in New Castle is $698.
The unemployment rate in New Castle is 13.8%.
The poverty rate in New Castle is 26.1%.
The average high in New Castle is 60.3° and the average low is 39.0°.
Table Of Contents
New Castle SnackAbility
Overall SnackAbility
New Castle, PA Cost Of Living
Cost of living in New Castle summary. We use data on the cost of living to determine how expensive it is to live in New Castle. Real estate prices drive most of the variance in cost of living around Pennsylvania. Key points include:
The cost of living in New Castle is 84 with 100 being average.
The cost of living in New Castle is 0.8x lower than the national average.
The median home value in New Castle is $139,068.
The median income in New Castle is $41,478.
New Castle's Overall Cost Of Living
Lower Than The National Average
Cost Of Living In New Castle Comparison Table
| Living Expense | New Castle | Pennsylvania | National Average | |
|---|---|---|---|---|
| Overall | 84 | 100 | 100 | |
| Services | 95 | 101 | 100 | |
| Groceries | 99 | 101 | 100 | |
| Health | 91 | 95 | 100 | |
| Housing | 44 | 93 | 100 | |
| Transportation | 108 | 108 | 100 | |
| Utilities | 126 | 108 | 100 | |
New Castle, PA Weather
The average high in New Castle is 60.3° and the average low is 39.0°.
There are 85.3 days of precipitation each year.
Expect an average of 39.5 inches of precipitation each year with 28.4 inches of snow.
| Stat | New Castle |
|---|---|
| Average Annual High | 60.3 |
| Average Annual Low | 39.0 |
| Annual Precipitation Days | 85.3 |
| Average Annual Precipitation | 39.5 |
| Average Annual Snowfall | 28.4 |
Average High
Days of Rain
New Castle, PA Photos
3 Reviews & Comments About New Castle
/5

Michelle M - None
My brother moved to New Castle from Baltimore 15 yrs ago. He started his family there and I've made many trips to the sleepy town but the 1st will always be the most memorable, thought I had traveled back in time. Everything looked so rustic, ran down, and deformed and this is coming from someone who grew up in the inner city of Baltimore yet the look of old poverty beat out any ghetto I've ever seen. With that being said this countdown is straight garbage because the people in New Castle are very charming and welcoming. You get a hometown family vibe from everyone, it's one of the few places where there's no division between races. Being a predominantly white town I've never once felt any tension when visiting there it's as if everybody is color blind which is unique and awesome. And there's little to NO crime there, I've only seen a police car twice. Their news consist of who's going to the tackle shop tomorrow. Jobs are scarce there and everybody appears to have some sort of disability or deformity. It's not a bad place however, I honestly think it's a government experimental town.
dmicc - None
I'm from New Castle. I know exactly why its #1. The drug epidemic is out of control. New Castle is uniquely situated right near a couple of 'main vein' interstates.
The perfect place to pump drugs up from the south and run them west to Detroit, Chicago, Columbus, Cleveland then to Pittsburgh, Philly, New York, and New Jersey. That's why New Castle and Youngstown were hot beds for the Mafia.
Same reason. And since there is no work there at all, no store fronts, nothing but empty rundown buildings, you're going to have poverty and problems.
Buster_Brownie - None
i live in new castle and never had a problem.
Rankings for New Castle in Pennsylvania


Locations Around New Castle
Map Of New Castle, PA
Best Places Around New Castle
Hubbard, OH
Population 7,600
Struthers, OH
Population 9,995
Columbiana, OH
Population 6,800
Campbell, OH
Population 7,812
Hermitage, PA
Population 16,132
New Brighton, PA
Population 5,600
Beaver Falls, PA
Population 8,885
Sharon, PA
Population 13,019
New Castle Demographics And Statistics
Population over time in New Castle
The current population in New Castle is 21,727. The population has decreased -8.8% from 2010.
| Year | Population | % Change |
|---|---|---|
| 2023 | 21,727 | -0.6% |
| 2022 | 21,863 | -0.6% |
| 2021 | 21,992 | 0.9% |
| 2020 | 21,805 | -0.8% |
| 2019 | 21,991 | -0.9% |
| 2018 | 22,188 | -1.1% |
| 2017 | 22,434 | -0.3% |
| 2016 | 22,500 | -0.8% |
| 2015 | 22,682 | -0.9% |
| 2014 | 22,883 | -0.9% |
| 2013 | 23,083 | -0.9% |
| 2012 | 23,290 | -1.2% |
| 2011 | 23,570 | -1.1% |
| 2010 | 23,836 | - |
Race / Ethnicity in New Castle
New Castle is:
75.7% White with 16,458 White residents.
10.4% African American with 2,253 African American residents.
0.0% American Indian with 4 American Indian residents.
0.0% Asian with 0 Asian residents.
0.0% Hawaiian with 0 Hawaiian residents.
0.4% Other with 97 Other residents.
8.5% Two Or More with 1,844 Two Or More residents.
4.9% Hispanic with 1,071 Hispanic residents.
| Race | New Castle | PA | USA |
|---|---|---|---|
| White | 75.7% | 73.8% | 58.2% |
| African American | 10.4% | 10.3% | 12.0% |
| American Indian | 0.0% | 0.1% | 0.5% |
| Asian | 0.0% | 3.7% | 5.7% |
| Hawaiian | 0.0% | 0.0% | 0.2% |
| Other | 0.4% | 0.4% | 0.5% |
| Two Or More | 8.5% | 3.3% | 3.9% |
| Hispanic | 4.9% | 8.4% | 19.0% |
Gender in New Castle
New Castle is 53.9% female with 11,705 female residents.
New Castle is 46.1% male with 10,022 male residents.
| Gender | New Castle | PA | USA |
|---|---|---|---|
| Female | 53.9% | 50.7% | 50.5% |
| Male | 46.1% | 49.3% | 49.5% |
Highest level of educational attainment in New Castle for adults over 25
3.0% of adults in New Castle completed < 9th grade.
8.0% of adults in New Castle completed 9-12th grade.
49.0% of adults in New Castle completed high school / ged.
17.0% of adults in New Castle completed some college.
8.0% of adults in New Castle completed associate's degree.
12.0% of adults in New Castle completed bachelor's degree.
3.0% of adults in New Castle completed master's degree.
0.0% of adults in New Castle completed professional degree.
0.0% of adults in New Castle completed doctorate degree.
| Education | New Castle | PA | USA |
|---|---|---|---|
| < 9th Grade | 3.0% | 3.0% | 5.0% |
| 9-12th Grade | 8.0% | 5.0% | 6.0% |
| High School / GED | 49.0% | 33.0% | 26.0% |
| Some College | 17.0% | 15.0% | 19.0% |
| Associate's Degree | 8.0% | 9.0% | 9.0% |
| Bachelor's Degree | 12.0% | 21.0% | 21.0% |
| Master's Degree | 3.0% | 10.0% | 10.0% |
| Professional Degree | 0.0% | 2.0% | 2.0% |
| Doctorate Degree | 0.0% | 2.0% | 2.0% |
Household Income For New Castle, Pennsylvania
7.8% of households in New Castle earn Less than $10,000.
12.6% of households in New Castle earn $10,000 to $14,999.
13.7% of households in New Castle earn $15,000 to $24,999.
9.2% of households in New Castle earn $25,000 to $34,999.
14.8% of households in New Castle earn $35,000 to $49,999.
18.5% of households in New Castle earn $50,000 to $74,999.
12.1% of households in New Castle earn $75,000 to $99,999.
8.9% of households in New Castle earn $100,000 to $149,999.
1.5% of households in New Castle earn $150,000 to $199,999.
1.1% of households in New Castle earn $200,000 or more.
| Income | New Castle | PA | USA |
|---|---|---|---|
| Less than $10,000 | 7.8% | 4.8% | 4.9% |
| $10,000 to $14,999 | 12.6% | 3.7% | 3.6% |
| $15,000 to $24,999 | 13.7% | 7.0% | 6.6% |
| $25,000 to $34,999 | 9.2% | 7.1% | 6.8% |
| $35,000 to $49,999 | 14.8% | 10.7% | 10.4% |
| $50,000 to $74,999 | 18.5% | 16.1% | 15.7% |
| $75,000 to $99,999 | 12.1% | 12.9% | 12.7% |
| $100,000 to $149,999 | 8.9% | 17.6% | 17.4% |
| $150,000 to $199,999 | 1.5% | 9.0% | 9.3% |
| $200,000 or more | 1.1% | 11.1% | 12.6% |


