Oxford SnackAbility
Overall SnackAbility
Cost of living in Oxford summary. We use data on the cost of living to determine how expensive it is to live in Oxford. Real estate prices drive most of the variance in cost of living around Pennsylvania. Key points include:
The cost of living in Oxford is 104 with 100 being average.
The cost of living in Oxford is 1.0x higher than the national average.
The median home value in Oxford is $465,377.
The median income in Oxford is $67,733.
Oxford's Overall Cost Of Living
Higher Than The National Average
Cost Of Living In Oxford Comparison Table
| Living Expense | Oxford | Pennsylvania | National Average |
|---|---|---|---|
| Overall | 104 | 97 | 100 |
| Services | 99 | 99 | 100 |
| Groceries | 99 | 100 | 100 |
| Health | 119 | 88 | 100 |
| Housing | 100 | 102 | 100 |
| Transportation | 102 | 100 | 100 |
| Utilities | 103 | 101 | 100 |
Source: Cost of living index, normalized to US average = 100
Oxford, PA Weather
The average high in Oxford is 62.7° and the average low is 42.6°.
There are 77.0 days of precipitation each year.
Expect an average of 47.0 inches of precipitation each year with 23.2 inches of snow.
| Stat | Oxford |
|---|---|
| Average Annual High | 62.7 |
| Average Annual Low | 42.6 |
| Annual Precipitation Days | 77.0 |
| Average Annual Precipitation | 47.0 |
| Average Annual Snowfall | 23.2 |
Average High
Days of Rain
Source: NOAA climate normals (30-year)
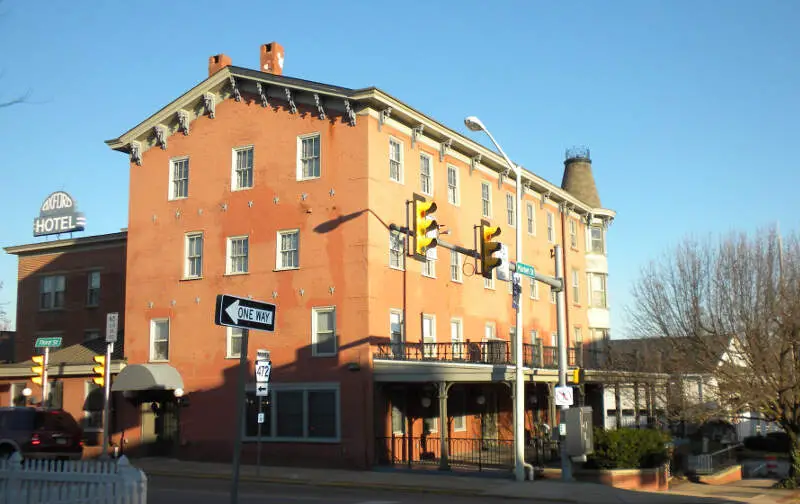
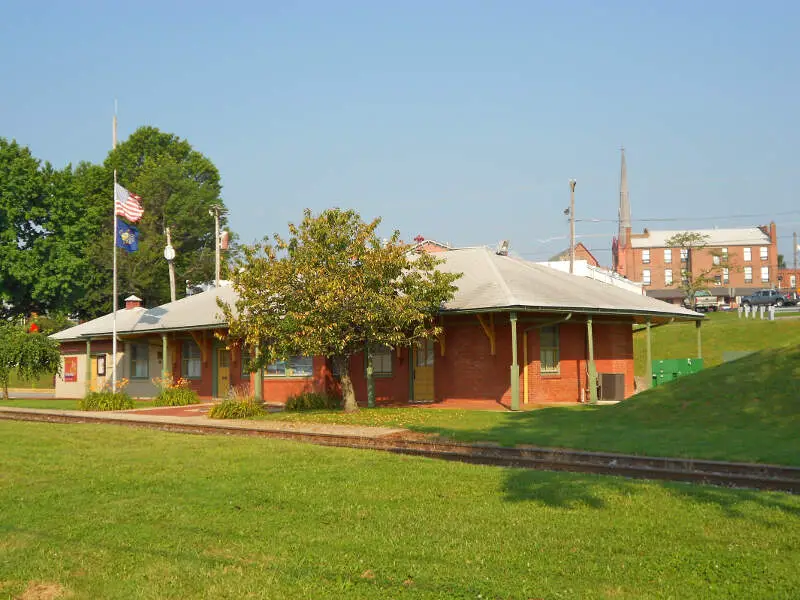
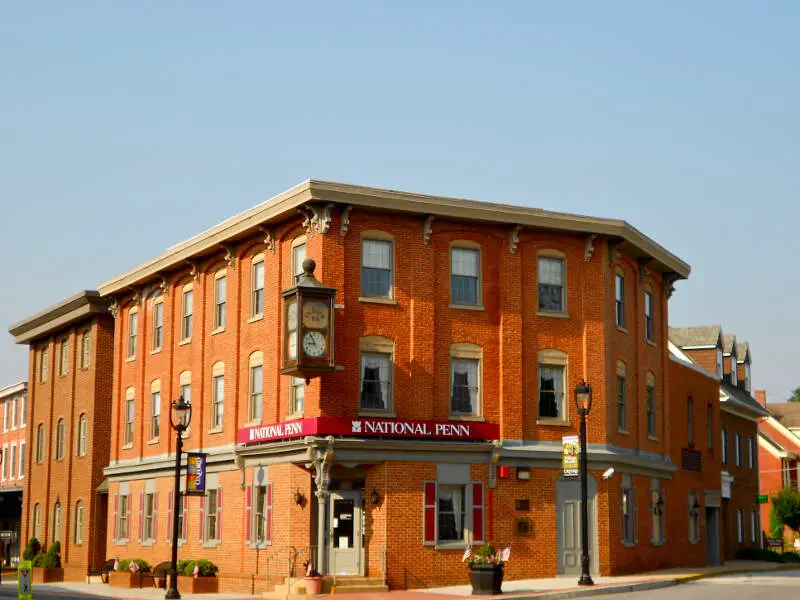
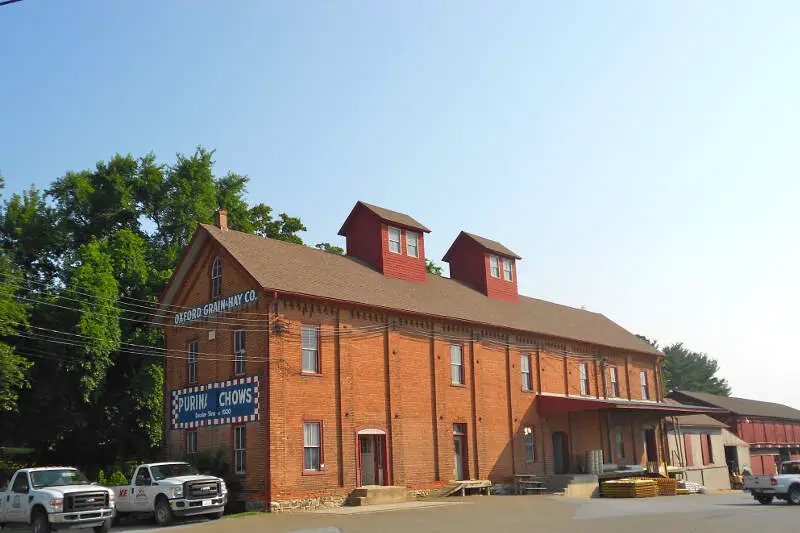
Oxford, PA Photos
Rankings & Articles For Oxford


Locations Around Oxford
Map Of Oxford, PA
Best Places Around Oxford
Kennett Square, PA
Population 6,243
Coatesville, PA
Population 13,353
Havre de Grace, MD
Population 14,994
Pike Creek, DE
Population 7,129
Hockessin, DE
Population 13,439
North Star, DE
Population 7,834
Glasgow, DE
Population 15,546
Pike Creek Valley, DE
Population 12,431
Bear, DE
Population 22,370
Oxford Demographics And Statistics
Population over time in Oxford
The current population in Oxford is 5,825. The population has increased 17.2% from 2010.
| Year | Population | % Change |
|---|---|---|
| 2024 | 5,825 | 1.1% |
| 2023 | 5,763 | 0.7% |
| 2022 | 5,724 | 0.9% |
| 2021 | 5,671 | 2.0% |
| 2020 | 5,560 | 0.8% |
| 2019 | 5,515 | 1.8% |
| 2018 | 5,420 | 1.7% |
| 2017 | 5,327 | 2.0% |
| 2016 | 5,221 | 1.1% |
| 2015 | 5,163 | 1.2% |
| 2014 | 5,100 | 0.2% |
| 2013 | 5,091 | 0.4% |
| 2012 | 5,069 | 0.6% |
| 2011 | 5,038 | 1.3% |
| 2010 | 4,971 | - |
Race / Ethnicity in Oxford
See the full breakdown
Oxford is:
56.1% White with 3,267 White residents.
6.8% African American with 399 African American residents.
0.0% American Indian with 0 American Indian residents.
2.7% Asian with 155 Asian residents.
0.0% Hawaiian with 0 Hawaiian residents.
0.0% Other with 0 Other residents.
3.6% Two Or More with 211 Two Or More residents.
30.8% Hispanic with 1,793 Hispanic residents.
| Race | Oxford | PA | USA |
|---|---|---|---|
| White | 56.1% | 73.0% | 57.4% |
| African American | 6.8% | 10.3% | 11.9% |
| American Indian | 0.0% | 0.1% | 0.5% |
| Asian | 2.7% | 3.8% | 5.9% |
| Hawaiian | 0.0% | 0.0% | 0.2% |
| Other | 0.0% | 0.5% | 0.6% |
| Two Or More | 3.6% | 3.6% | 4.3% |
| Hispanic | 30.8% | 8.7% | 19.3% |
Gender in Oxford
See the full breakdown
Oxford is 48.7% female with 2,837 female residents.
Oxford is 51.3% male with 2,987 male residents.
| Gender | Oxford | PA | USA |
|---|---|---|---|
| Female | 48.7% | 50.7% | 50.5% |
| Male | 51.3% | 49.3% | 49.5% |
Highest level of educational attainment in Oxford for adults over 25
See the full breakdown
8.0% of adults in Oxford completed < 9th grade.
10.0% of adults in Oxford completed 9-12th grade.
31.0% of adults in Oxford completed high school / ged.
9.0% of adults in Oxford completed some college.
9.0% of adults in Oxford completed associate's degree.
14.0% of adults in Oxford completed bachelor's degree.
15.0% of adults in Oxford completed master's degree.
0.0% of adults in Oxford completed professional degree.
4.0% of adults in Oxford completed doctorate degree.
| Education | Oxford | PA | USA |
|---|---|---|---|
| < 9th Grade | 8.0% | 3.0% | 4.0% |
| 9-12th Grade | 10.0% | 5.0% | 6.0% |
| High School / GED | 31.0% | 33.0% | 26.0% |
| Some College | 9.0% | 15.0% | 19.0% |
| Associate's Degree | 9.0% | 9.0% | 9.0% |
| Bachelor's Degree | 14.0% | 21.0% | 22.0% |
| Master's Degree | 15.0% | 10.0% | 10.0% |
| Professional Degree | 0.0% | 2.0% | 2.0% |
| Doctorate Degree | 4.0% | 2.0% | 2.0% |
Household Income For Oxford, Pennsylvania
See the full breakdown
4.5% of households in Oxford earn Less than $10,000.
4.2% of households in Oxford earn $10,000 to $14,999.
13.3% of households in Oxford earn $15,000 to $24,999.
7.6% of households in Oxford earn $25,000 to $34,999.
15.6% of households in Oxford earn $35,000 to $49,999.
6.7% of households in Oxford earn $50,000 to $74,999.
10.1% of households in Oxford earn $75,000 to $99,999.
15.5% of households in Oxford earn $100,000 to $149,999.
7.9% of households in Oxford earn $150,000 to $199,999.
14.6% of households in Oxford earn $200,000 or more.
| Income | Oxford | PA | USA |
|---|---|---|---|
| Less than $10,000 | 4.5% | 4.9% | 5.0% |
| $10,000 to $14,999 | 4.2% | 3.5% | 3.4% |
| $15,000 to $24,999 | 13.3% | 6.7% | 6.3% |
| $25,000 to $34,999 | 7.6% | 6.9% | 6.6% |
| $35,000 to $49,999 | 15.6% | 10.5% | 10.1% |
| $50,000 to $74,999 | 6.7% | 15.9% | 15.5% |
| $75,000 to $99,999 | 10.1% | 12.8% | 12.6% |
| $100,000 to $149,999 | 15.5% | 17.7% | 17.5% |
| $150,000 to $199,999 | 7.9% | 9.3% | 9.6% |
| $200,000 or more | 14.6% | 11.8% | 13.4% |
Source: U.S. Census ACS 5-year estimates (2024)


