Binghamton SnackAbility
Overall SnackAbility
Crime in Binghamton summary. We use data from the FBI to determine the crime rates in Binghamton. Key points include:
There were 1,830 total crimes in Binghamton in the last reporting year.
The overall crime rate per 100,000 people in Binghamton is 3,945.8 / 100k people.
The violent crime rate per 100,000 people in Binghamton is 532.6 / 100k people.
The property crime rate per 100,000 people in Binghamton is 3,413.3 / 100k people.
Overall, crime in Binghamton is 86.19% above the national average.
Total Crimes
Above National Average
Crime In Binghamton Comparison Table
| Statistic | Count Raw |
Binghamton / 100k People |
New York / 100k People |
National / 100k People |
|---|---|---|---|---|
| Total Crimes Per 100K | 1,830 | 3,945.8 | 2,099.7 | 2,119.2 |
| Violent Crime | 247 | 532.6 | 380.2 | 359.0 |
| Murder | 3 | 6.5 | 2.7 | 5.0 |
| Robbery | 34 | 73.3 | 96.1 | 61.0 |
| Aggravated Assault | 183 | 394.6 | 259.6 | 256.0 |
| Property Crime | 1,583 | 3,413.3 | 1,719.5 | 1,760.0 |
| Burglary | 196 | 422.6 | 136.6 | 229.0 |
| Larceny | 1,293 | 2,788.0 | 1,432.8 | 1,272.0 |
| Car Theft | 94 | 202.7 | 150.2 | 259.0 |
Source: FBI Uniform Crime Reporting (2024)
Cost of living in Binghamton summary. We use data on the cost of living to determine how expensive it is to live in Binghamton. Real estate prices drive most of the variance in cost of living around New York. Key points include:
The cost of living in Binghamton is 95 with 100 being average.
The cost of living in Binghamton is 0.9x lower than the national average.
The median home value in Binghamton is $181,129.
The median income in Binghamton is $45,578.
Binghamton's Overall Cost Of Living
Lower Than The National Average
Cost Of Living In Binghamton Comparison Table
| Living Expense | Binghamton | New York | National Average |
|---|---|---|---|
| Overall | 95 | 121 | 100 |
| Services | 106 | 105 | 100 |
| Groceries | 111 | 108 | 100 |
| Health | 60 | 143 | 100 |
| Housing | 116 | 112 | 100 |
| Transportation | 111 | 114 | 100 |
| Utilities | 111 | 111 | 100 |
Source: Cost of living index, normalized to US average = 100
Binghamton, NY Weather
The average high in Binghamton is 56.8° and the average low is 35.9°.
There are 87.3 days of precipitation each year.
Expect an average of 40.1 inches of precipitation each year with 73.3 inches of snow.
| Stat | Binghamton |
|---|---|
| Average Annual High | 56.8 |
| Average Annual Low | 35.9 |
| Annual Precipitation Days | 87.3 |
| Average Annual Precipitation | 40.1 |
| Average Annual Snowfall | 73.3 |
Average High
Days of Rain
Source: NOAA climate normals (30-year)
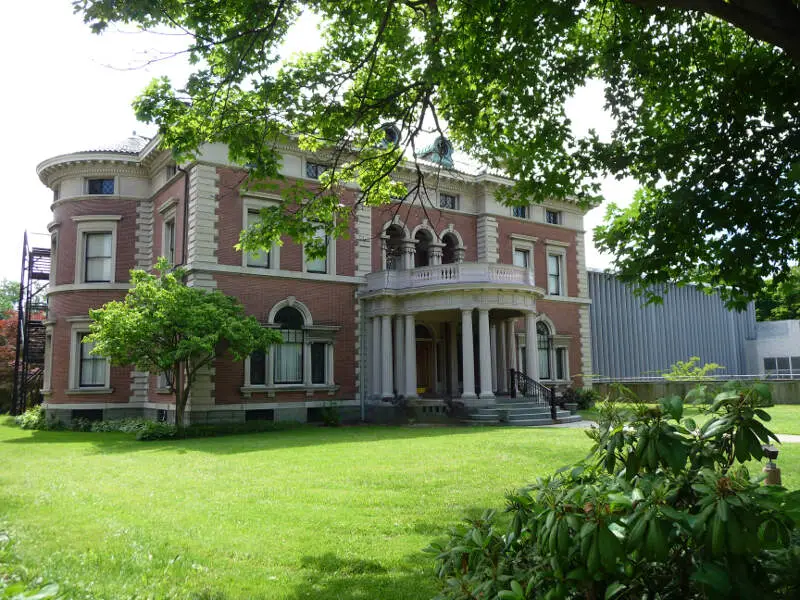
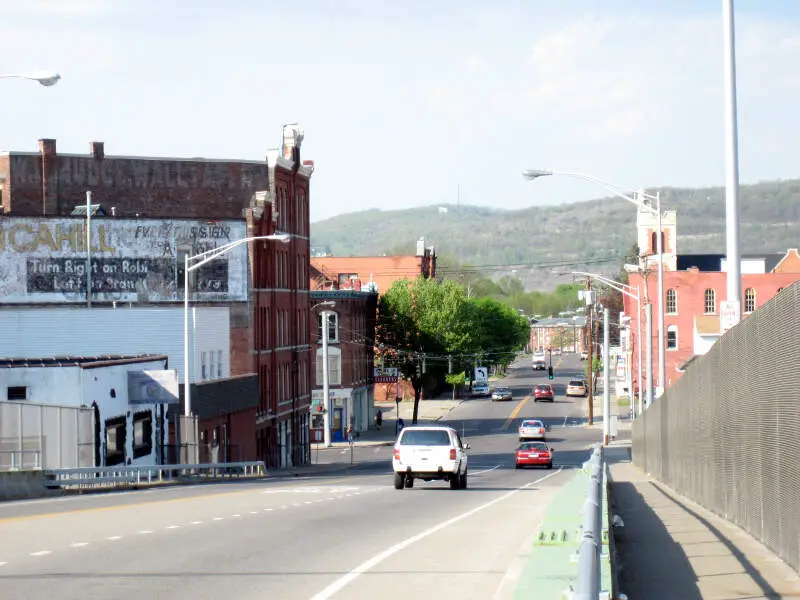
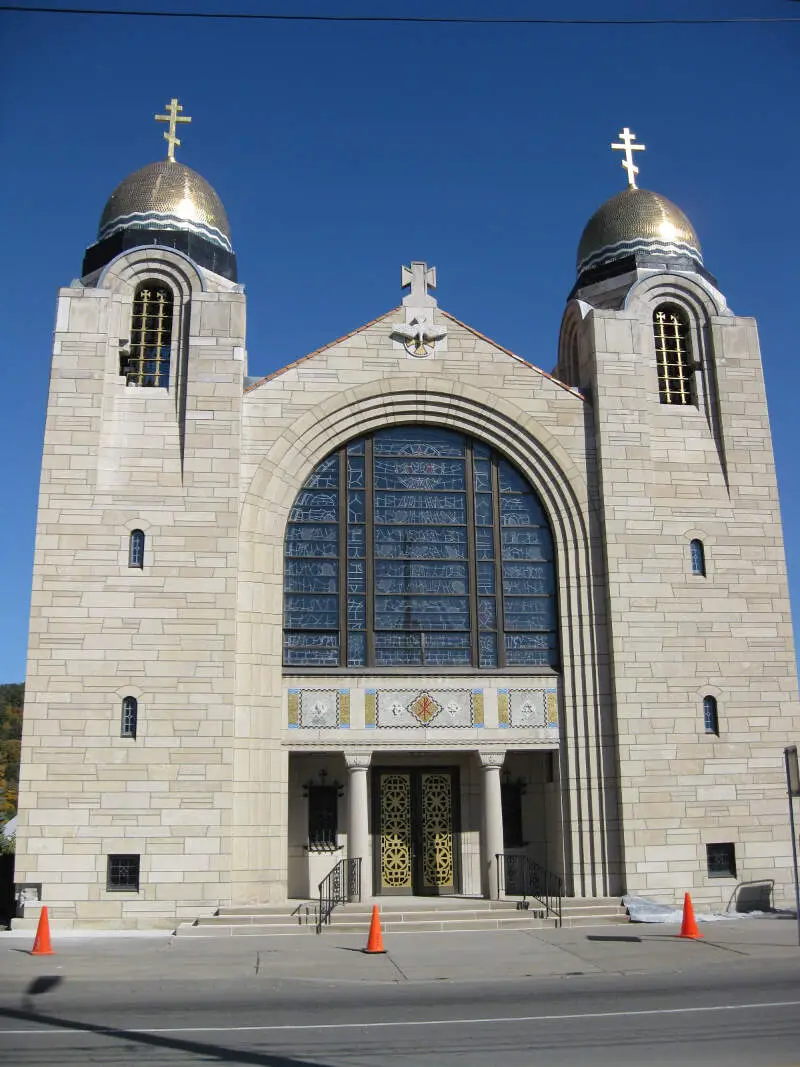
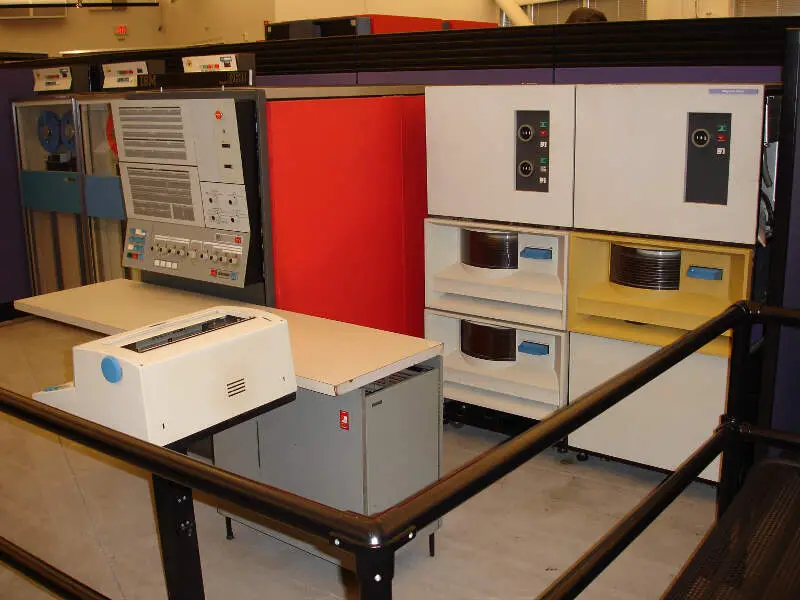
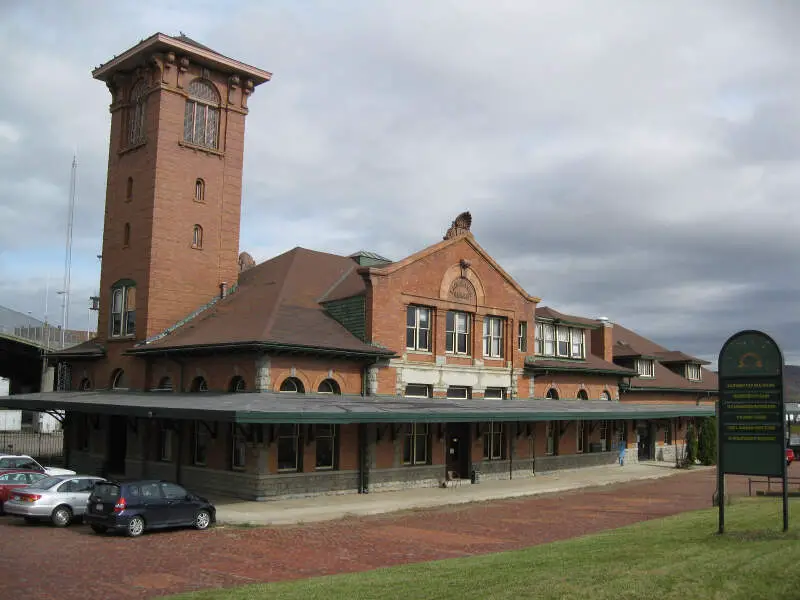
Binghamton, NY Photos
1 Reviews & Comments About Binghamton

Crime: I lived in the Binghamton area for 50+ years. There are some bad areas as with any town but I only had a few incidents in all those years. It is not a city of urban decay and violence.
Jobs: Mostly service oriented. If you are in the tech field go elsewhere. There is Lockheed Martin, BAE and Universal Instruments and not much else. These companies are dependent on contracts for their survival so expect layoffs/downturns. There is a large skilled labor force looking for work due to the rotten economy so good jobs are hard to find.
Weather: Overcast with a 75% chance of rain throughout the day.
Cost of living: Houses are cheap but taxes and everything else offsets that.
People: Generally the folks are pretty darn good. A mix of rightwingers and liberals. People seem to be tolerant and will give you a chance if you don't act like an idiot. Not much money but good people.
Weather and economy are depressing.
There are things to do outside when the rain and snow stops. Tennis, biking, hiking, parks.
I cant comment on the night life but a large amount of students reside there during the school year so there must be some entertainment.
There are nice shops and restaurants and museums. Everything is close by.
Traffic is not a problem as most people left decades ago.
If you are retirement age then it is a great place to live. Plenty of medicenters and clinics.
If you are young then get out while you can.
Binghamton is like living at your parents house: You have what you need to survive but you cant wait to leave.
Rankings & Articles For Binghamton


Locations Around Binghamton
Map Of Binghamton, NY
Best Places Around Binghamton
South Hill, NY
Population 6,951
Ithaca, NY
Population 32,814
Endwell, NY
Population 11,546
Clarks Summit, PA
Population 5,073
Oneonta, NY
Population 15,045
Sayre, PA
Population 5,431
Norwich, NY
Population 6,782
Blakely, PA
Population 6,662
Cortland, NY
Population 17,450
Endicott, NY
Population 13,387
Binghamton Demographics And Statistics
Population over time in Binghamton
The current population in Binghamton is 47,151. The population has decreased 0.5% from 2010.
| Year | Population | % Change |
|---|---|---|
| 2024 | 47,151 | -0.4% |
| 2023 | 47,357 | -0.5% |
| 2022 | 47,617 | -0.4% |
| 2021 | 47,828 | 6.7% |
| 2020 | 44,819 | -0.7% |
| 2019 | 45,140 | -0.8% |
| 2018 | 45,503 | -1.0% |
| 2017 | 45,964 | -0.7% |
| 2016 | 46,277 | -0.5% |
| 2015 | 46,495 | -0.6% |
| 2014 | 46,771 | -0.4% |
| 2013 | 46,975 | -0.3% |
| 2012 | 47,107 | -0.4% |
| 2011 | 47,313 | -0.2% |
| 2010 | 47,391 | - |
Race / Ethnicity in Binghamton
See the full breakdown
Binghamton is:
64.9% White with 30,590 White residents.
13.0% African American with 6,125 African American residents.
0.2% American Indian with 86 American Indian residents.
6.8% Asian with 3,199 Asian residents.
0.1% Hawaiian with 29 Hawaiian residents.
0.3% Other with 144 Other residents.
5.3% Two Or More with 2,500 Two Or More residents.
9.5% Hispanic with 4,478 Hispanic residents.
| Race | Binghamton | NY | USA |
|---|---|---|---|
| White | 64.9% | 52.8% | 57.4% |
| African American | 13.0% | 13.4% | 11.9% |
| American Indian | 0.2% | 0.2% | 0.5% |
| Asian | 6.8% | 9.0% | 5.9% |
| Hawaiian | 0.1% | 0.0% | 0.2% |
| Other | 0.3% | 1.0% | 0.6% |
| Two Or More | 5.3% | 3.8% | 4.3% |
| Hispanic | 9.5% | 19.8% | 19.3% |
Gender in Binghamton
See the full breakdown
Binghamton is 51.8% female with 24,415 female residents.
Binghamton is 48.2% male with 22,735 male residents.
| Gender | Binghamton | NY | USA |
|---|---|---|---|
| Female | 51.8% | 51.2% | 50.5% |
| Male | 48.2% | 48.8% | 49.5% |
Highest level of educational attainment in Binghamton for adults over 25
See the full breakdown
5.0% of adults in Binghamton completed < 9th grade.
9.0% of adults in Binghamton completed 9-12th grade.
28.0% of adults in Binghamton completed high school / ged.
17.0% of adults in Binghamton completed some college.
11.0% of adults in Binghamton completed associate's degree.
16.0% of adults in Binghamton completed bachelor's degree.
10.0% of adults in Binghamton completed master's degree.
2.0% of adults in Binghamton completed professional degree.
2.0% of adults in Binghamton completed doctorate degree.
| Education | Binghamton | NY | USA |
|---|---|---|---|
| < 9th Grade | 5.0% | 6.0% | 4.0% |
| 9-12th Grade | 9.0% | 6.0% | 6.0% |
| High School / GED | 28.0% | 24.0% | 26.0% |
| Some College | 17.0% | 15.0% | 19.0% |
| Associate's Degree | 11.0% | 9.0% | 9.0% |
| Bachelor's Degree | 16.0% | 22.0% | 22.0% |
| Master's Degree | 10.0% | 13.0% | 10.0% |
| Professional Degree | 2.0% | 3.0% | 2.0% |
| Doctorate Degree | 2.0% | 2.0% | 2.0% |
Household Income For Binghamton, New York
See the full breakdown
11.7% of households in Binghamton earn Less than $10,000.
7.5% of households in Binghamton earn $10,000 to $14,999.
11.0% of households in Binghamton earn $15,000 to $24,999.
8.5% of households in Binghamton earn $25,000 to $34,999.
14.0% of households in Binghamton earn $35,000 to $49,999.
15.0% of households in Binghamton earn $50,000 to $74,999.
11.4% of households in Binghamton earn $75,000 to $99,999.
11.6% of households in Binghamton earn $100,000 to $149,999.
4.7% of households in Binghamton earn $150,000 to $199,999.
4.6% of households in Binghamton earn $200,000 or more.
| Income | Binghamton | NY | USA |
|---|---|---|---|
| Less than $10,000 | 11.7% | 5.8% | 5.0% |
| $10,000 to $14,999 | 7.5% | 3.9% | 3.4% |
| $15,000 to $24,999 | 11.0% | 6.3% | 6.3% |
| $25,000 to $34,999 | 8.5% | 6.2% | 6.6% |
| $35,000 to $49,999 | 14.0% | 8.9% | 10.1% |
| $50,000 to $74,999 | 15.0% | 13.6% | 15.5% |
| $75,000 to $99,999 | 11.4% | 11.4% | 12.6% |
| $100,000 to $149,999 | 11.6% | 16.7% | 17.5% |
| $150,000 to $199,999 | 4.7% | 10.1% | 9.6% |
| $200,000 or more | 4.6% | 17.1% | 13.4% |
Source: U.S. Census ACS 5-year estimates (2024)


