Somerset SnackAbility
Overall SnackAbility
Cost of living in Somerset summary. We use data on the cost of living to determine how expensive it is to live in Somerset. Real estate prices drive most of the variance in cost of living around Pennsylvania. Key points include:
The cost of living in Somerset is 89 with 100 being average.
The cost of living in Somerset is 0.9x lower than the national average.
The median home value in Somerset is $217,890.
The median income in Somerset is $47,102.
Somerset's Overall Cost Of Living
Lower Than The National Average
Cost Of Living In Somerset Comparison Table
| Living Expense | Somerset | Pennsylvania | National Average |
|---|---|---|---|
| Overall | 89 | 97 | 100 |
| Services | 96 | 99 | 100 |
| Groceries | 95 | 100 | 100 |
| Health | 60 | 88 | 100 |
| Housing | 102 | 102 | 100 |
| Transportation | 98 | 100 | 100 |
| Utilities | 96 | 101 | 100 |
Source: Cost of living index, normalized to US average = 100
Somerset, PA Weather
The average high in Somerset is 57.8° and the average low is 36.9°.
There are 96.0 days of precipitation each year.
Expect an average of 43.6 inches of precipitation each year with 89.3 inches of snow.
| Stat | Somerset |
|---|---|
| Average Annual High | 57.8 |
| Average Annual Low | 36.9 |
| Annual Precipitation Days | 96.0 |
| Average Annual Precipitation | 43.6 |
| Average Annual Snowfall | 89.3 |
Average High
Days of Rain
Source: NOAA climate normals (30-year)
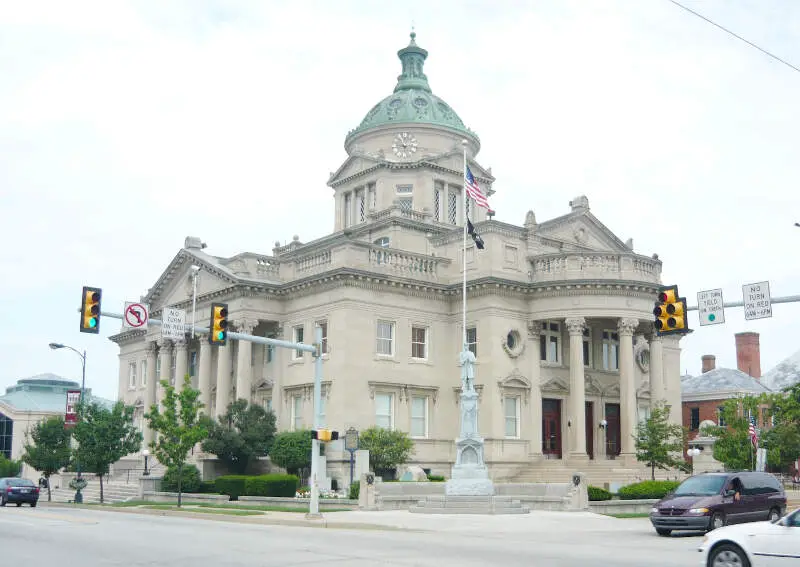
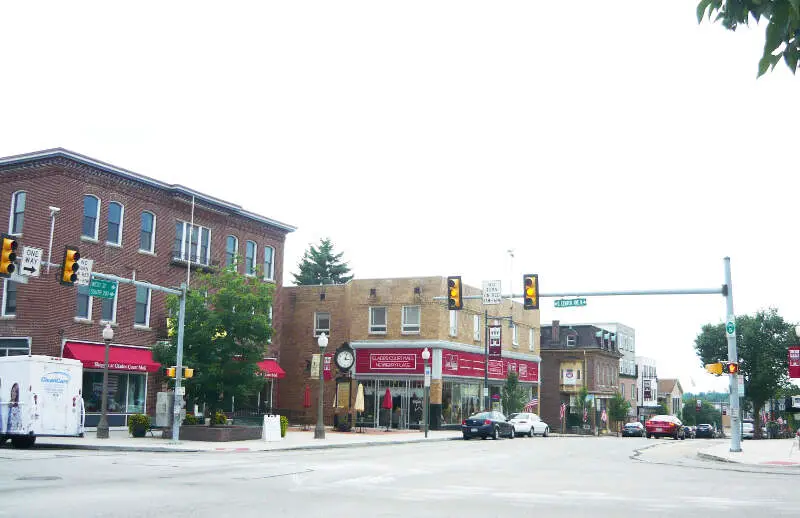
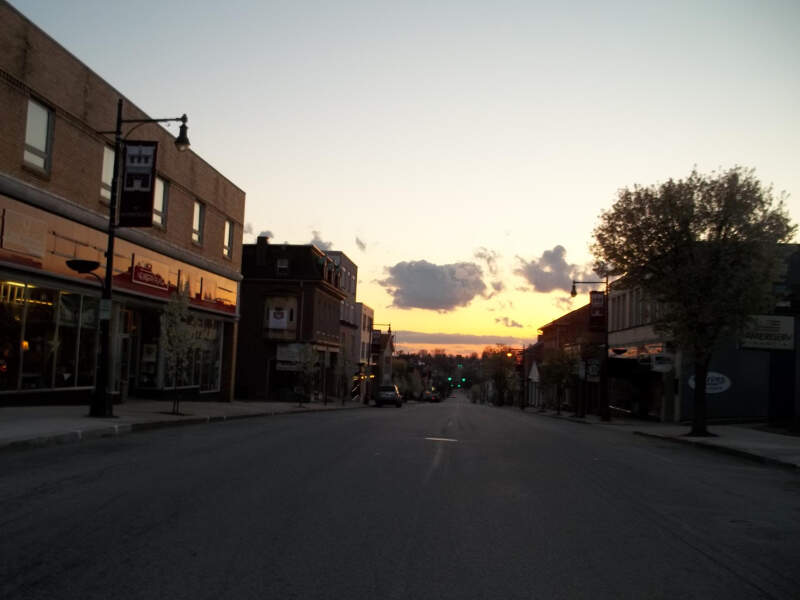
Somerset, PA Photos
Rankings & Articles For Somerset


Locations Around Somerset
Map Of Somerset, PA
Best Places Around Somerset
Plum, PA
Population 26,723
Jefferson Hills, PA
Population 12,317
White Oak, PA
Population 7,468
Indiana, PA
Population 14,212
Turtle Creek, PA
Population 5,007
Westmont, PA
Population 4,855
Hollidaysburg, PA
Population 5,558
Jeannette, PA
Population 8,657
Bel Air, MD
Population 1,837
Bel Air, MD
Population 1,837
Somerset Demographics And Statistics
Population over time in Somerset
The current population in Somerset is 5,944. The population has decreased 6.4% from 2010.
| Year | Population | % Change |
|---|---|---|
| 2024 | 5,944 | -0.7% |
| 2023 | 5,984 | -0.8% |
| 2022 | 6,030 | -0.5% |
| 2021 | 6,059 | 2.9% |
| 2020 | 5,888 | -0.9% |
| 2019 | 5,942 | -0.6% |
| 2018 | 5,977 | -1.0% |
| 2017 | 6,035 | -1.1% |
| 2016 | 6,102 | -0.4% |
| 2015 | 6,127 | -0.9% |
| 2014 | 6,185 | -0.7% |
| 2013 | 6,227 | -0.6% |
| 2012 | 6,267 | -0.8% |
| 2011 | 6,317 | -0.6% |
| 2010 | 6,353 | - |
Race / Ethnicity in Somerset
See the full breakdown
Somerset is:
89.5% White with 5,318 White residents.
4.9% African American with 291 African American residents.
0.0% American Indian with 0 American Indian residents.
1.0% Asian with 61 Asian residents.
0.0% Hawaiian with 0 Hawaiian residents.
0.0% Other with 0 Other residents.
3.0% Two Or More with 181 Two Or More residents.
1.6% Hispanic with 93 Hispanic residents.
| Race | Somerset | PA | USA |
|---|---|---|---|
| White | 89.5% | 73.0% | 57.4% |
| African American | 4.9% | 10.3% | 11.9% |
| American Indian | 0.0% | 0.1% | 0.5% |
| Asian | 1.0% | 3.8% | 5.9% |
| Hawaiian | 0.0% | 0.0% | 0.2% |
| Other | 0.0% | 0.5% | 0.6% |
| Two Or More | 3.0% | 3.6% | 4.3% |
| Hispanic | 1.6% | 8.7% | 19.3% |
Gender in Somerset
See the full breakdown
Somerset is 52.8% female with 3,138 female residents.
Somerset is 47.2% male with 2,805 male residents.
| Gender | Somerset | PA | USA |
|---|---|---|---|
| Female | 52.8% | 50.7% | 50.5% |
| Male | 47.2% | 49.3% | 49.5% |
Highest level of educational attainment in Somerset for adults over 25
See the full breakdown
3.0% of adults in Somerset completed < 9th grade.
7.0% of adults in Somerset completed 9-12th grade.
39.0% of adults in Somerset completed high school / ged.
18.0% of adults in Somerset completed some college.
8.0% of adults in Somerset completed associate's degree.
11.0% of adults in Somerset completed bachelor's degree.
8.0% of adults in Somerset completed master's degree.
2.0% of adults in Somerset completed professional degree.
4.0% of adults in Somerset completed doctorate degree.
| Education | Somerset | PA | USA |
|---|---|---|---|
| < 9th Grade | 3.0% | 3.0% | 4.0% |
| 9-12th Grade | 7.0% | 5.0% | 6.0% |
| High School / GED | 39.0% | 33.0% | 26.0% |
| Some College | 18.0% | 15.0% | 19.0% |
| Associate's Degree | 8.0% | 9.0% | 9.0% |
| Bachelor's Degree | 11.0% | 21.0% | 22.0% |
| Master's Degree | 8.0% | 10.0% | 10.0% |
| Professional Degree | 2.0% | 2.0% | 2.0% |
| Doctorate Degree | 4.0% | 2.0% | 2.0% |
Household Income For Somerset, Pennsylvania
See the full breakdown
6.5% of households in Somerset earn Less than $10,000.
4.7% of households in Somerset earn $10,000 to $14,999.
20.6% of households in Somerset earn $15,000 to $24,999.
10.1% of households in Somerset earn $25,000 to $34,999.
10.4% of households in Somerset earn $35,000 to $49,999.
11.5% of households in Somerset earn $50,000 to $74,999.
9.1% of households in Somerset earn $75,000 to $99,999.
15.4% of households in Somerset earn $100,000 to $149,999.
6.2% of households in Somerset earn $150,000 to $199,999.
5.5% of households in Somerset earn $200,000 or more.
| Income | Somerset | PA | USA |
|---|---|---|---|
| Less than $10,000 | 6.5% | 4.9% | 5.0% |
| $10,000 to $14,999 | 4.7% | 3.5% | 3.4% |
| $15,000 to $24,999 | 20.6% | 6.7% | 6.3% |
| $25,000 to $34,999 | 10.1% | 6.9% | 6.6% |
| $35,000 to $49,999 | 10.4% | 10.5% | 10.1% |
| $50,000 to $74,999 | 11.5% | 15.9% | 15.5% |
| $75,000 to $99,999 | 9.1% | 12.8% | 12.6% |
| $100,000 to $149,999 | 15.4% | 17.7% | 17.5% |
| $150,000 to $199,999 | 6.2% | 9.3% | 9.6% |
| $200,000 or more | 5.5% | 11.8% | 13.4% |
Source: U.S. Census ACS 5-year estimates (2024)


