Wilkes-Barre SnackAbility
Overall SnackAbility
Crime in Wilkes-Barre summary. We use data from the FBI to determine the crime rates in Wilkes-Barre. Key points include:
There were 880 total crimes in Wilkes-Barre in the last reporting year.
The overall crime rate per 100,000 people in Wilkes-Barre is 1,988.5 / 100k people.
The violent crime rate per 100,000 people in Wilkes-Barre is 431.6 / 100k people.
The property crime rate per 100,000 people in Wilkes-Barre is 1,556.9 / 100k people.
Overall, crime in Wilkes-Barre is -6.17% below the national average.
Total Crimes
Below National Average
Crime In Wilkes-Barre Comparison Table
| Statistic | Count Raw |
Wilkes-Barre / 100k People |
Pennsylvania / 100k People |
National / 100k People |
|---|---|---|---|---|
| Total Crimes Per 100K | 880 | 1,988.5 | 1,680.6 | 2,119.2 |
| Violent Crime | 191 | 431.6 | 245.6 | 359.0 |
| Murder | 4 | 9.0 | 5.0 | 5.0 |
| Robbery | 25 | 56.5 | 51.4 | 61.0 |
| Aggravated Assault | 143 | 323.1 | 161.4 | 256.0 |
| Property Crime | 689 | 1,556.9 | 1,435.0 | 1,760.0 |
| Burglary | 73 | 165.0 | 116.7 | 229.0 |
| Larceny | 567 | 1,281.2 | 1,129.8 | 1,272.0 |
| Car Theft | 49 | 110.7 | 188.5 | 259.0 |
Source: FBI Uniform Crime Reporting (2024)
Cost of living in Wilkes-Barre summary. We use data on the cost of living to determine how expensive it is to live in Wilkes-Barre. Real estate prices drive most of the variance in cost of living around Pennsylvania. Key points include:
The cost of living in Wilkes-Barre is 86 with 100 being average.
The cost of living in Wilkes-Barre is 0.9x lower than the national average.
The median home value in Wilkes-Barre is $172,140.
The median income in Wilkes-Barre is $48,515.
Wilkes-Barre's Overall Cost Of Living
Lower Than The National Average
Cost Of Living In Wilkes-Barre Comparison Table
| Living Expense | Wilkes-Barre | Pennsylvania | National Average |
|---|---|---|---|
| Overall | 86 | 97 | 100 |
| Services | 99 | 99 | 100 |
| Groceries | 97 | 100 | 100 |
| Health | 53 | 88 | 100 |
| Housing | 100 | 102 | 100 |
| Transportation | 100 | 100 | 100 |
| Utilities | 103 | 101 | 100 |
Source: Cost of living index, normalized to US average = 100
Wilkes-Barre, PA Weather
The average high in Wilkes-Barre is 60.3° and the average low is 40.4°.
There are 76.6 days of precipitation each year.
Expect an average of 41.0 inches of precipitation each year with 33.4 inches of snow.
| Stat | Wilkes-Barre |
|---|---|
| Average Annual High | 60.3 |
| Average Annual Low | 40.4 |
| Annual Precipitation Days | 76.6 |
| Average Annual Precipitation | 41.0 |
| Average Annual Snowfall | 33.4 |
Average High
Days of Rain
Source: NOAA climate normals (30-year)
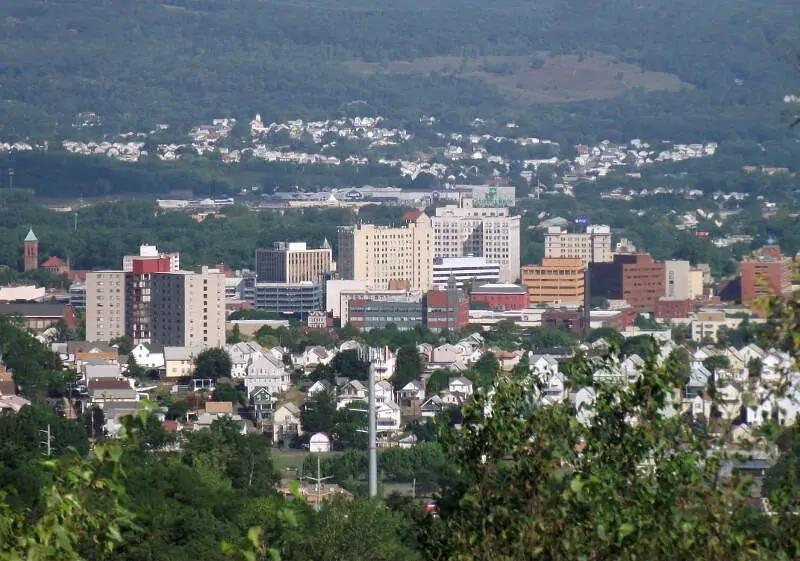
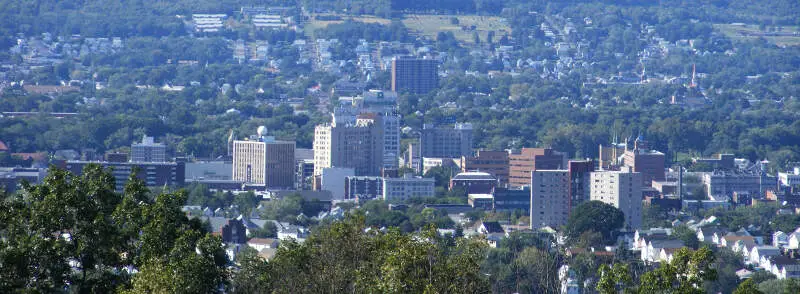
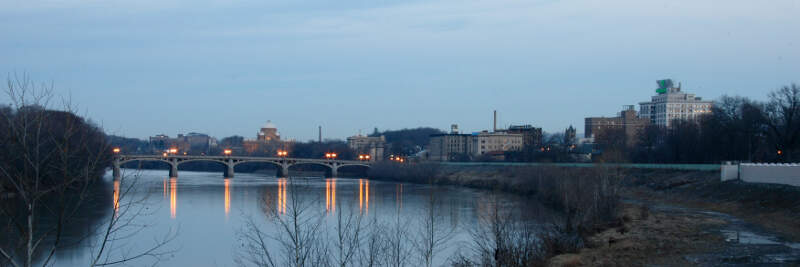
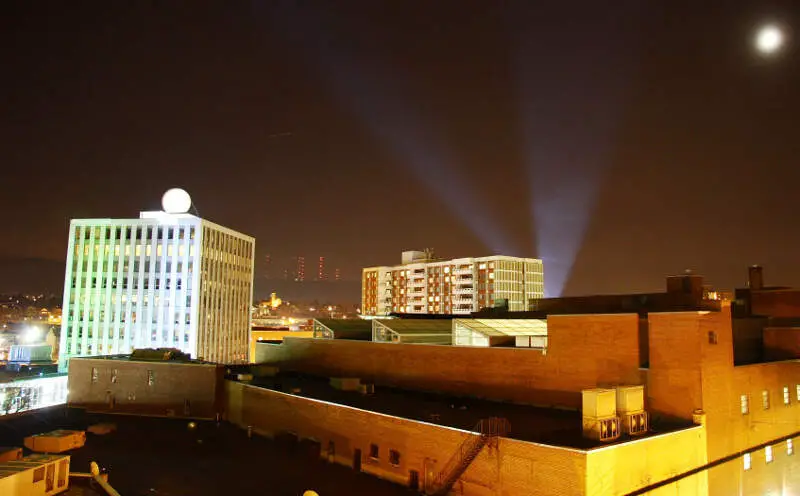
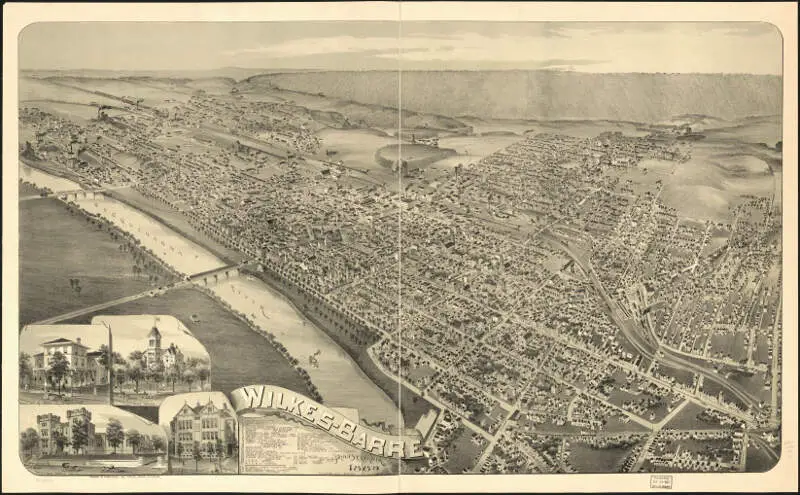
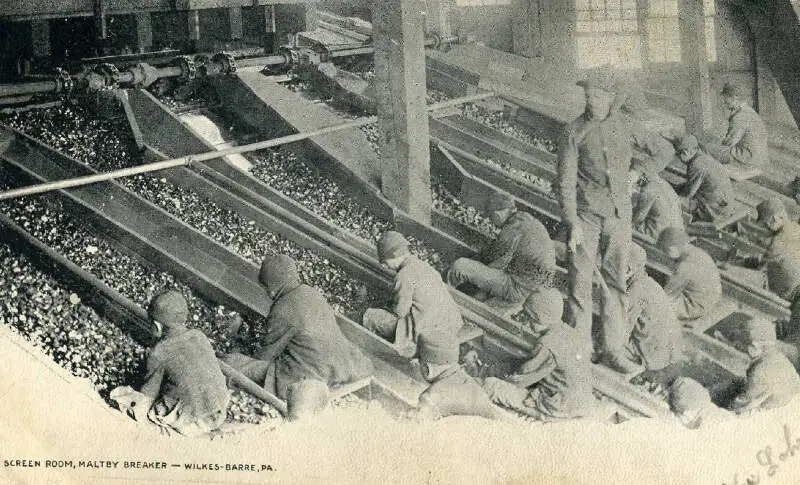
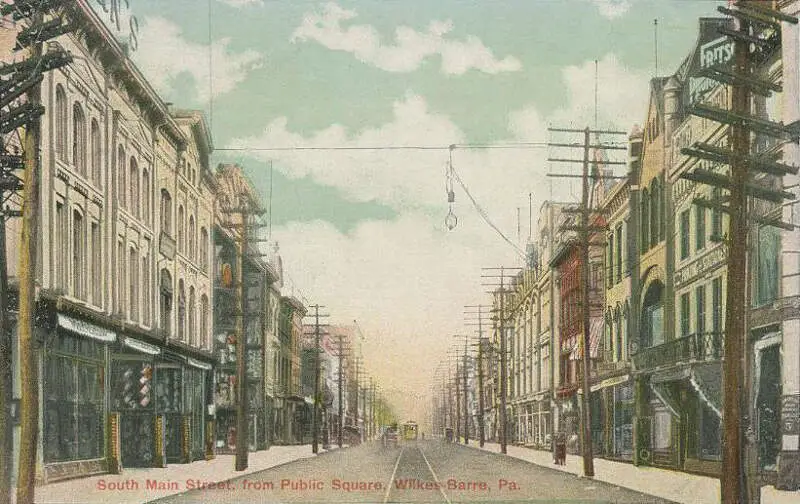
Wilkes-Barre, PA Photos


Rankings & Articles For Wilkes-Barre


Locations Around Wilkes-Barre
Map Of Wilkes-Barre, PA
Best Places Around Wilkes-Barre
Clarks Summit, PA
Population 5,073
Mountain Top, PA
Population 11,850
Old Forge, PA
Population 8,573
Kingston, PA
Population 13,397
Dunmore, PA
Population 14,181
Dickson, TN
Population 16,424
Swoyersville, PA
Population 5,048
Taylor, PA
Population 6,265
Exeter, PA
Population 5,541
Moosic, PA
Population 5,973
Wilkes-Barre Demographics And Statistics
Population over time in Wilkes-Barre
The current population in Wilkes-Barre is 44,423. The population has increased 6.8% from 2010.
| Year | Population | % Change |
|---|---|---|
| 2024 | 44,423 | 0.5% |
| 2023 | 44,217 | 0.2% |
| 2022 | 44,123 | 0.1% |
| 2021 | 44,086 | 8.0% |
| 2020 | 40,805 | -0.2% |
| 2019 | 40,867 | 0.0% |
| 2018 | 40,847 | - |
| 2017 | 0 | -100.0% |
| 2016 | 40,964 | -0.4% |
| 2015 | 41,108 | -0.2% |
| 2014 | 41,202 | -0.4% |
| 2013 | 41,374 | -0.2% |
| 2012 | 41,463 | -0.2% |
| 2011 | 41,557 | -0.1% |
| 2010 | 41,595 | - |
Race / Ethnicity in Wilkes-Barre
See the full breakdown
Wilkes-Barre is:
50.5% White with 22,442 White residents.
9.7% African American with 4,317 African American residents.
0.0% American Indian with 10 American Indian residents.
1.6% Asian with 712 Asian residents.
0.0% Hawaiian with 0 Hawaiian residents.
0.4% Other with 180 Other residents.
4.0% Two Or More with 1,765 Two Or More residents.
33.8% Hispanic with 14,997 Hispanic residents.
| Race | Wilkes-Barre | PA | USA |
|---|---|---|---|
| White | 50.5% | 73.0% | 57.4% |
| African American | 9.7% | 10.3% | 11.9% |
| American Indian | 0.0% | 0.1% | 0.5% |
| Asian | 1.6% | 3.8% | 5.9% |
| Hawaiian | 0.0% | 0.0% | 0.2% |
| Other | 0.4% | 0.5% | 0.6% |
| Two Or More | 4.0% | 3.6% | 4.3% |
| Hispanic | 33.8% | 8.7% | 19.3% |
Gender in Wilkes-Barre
See the full breakdown
Wilkes-Barre is 51.1% female with 22,688 female residents.
Wilkes-Barre is 48.9% male with 21,735 male residents.
| Gender | Wilkes-Barre | PA | USA |
|---|---|---|---|
| Female | 51.1% | 50.7% | 50.5% |
| Male | 48.9% | 49.3% | 49.5% |
Highest level of educational attainment in Wilkes-Barre for adults over 25
See the full breakdown
5.0% of adults in Wilkes-Barre completed < 9th grade.
10.0% of adults in Wilkes-Barre completed 9-12th grade.
39.0% of adults in Wilkes-Barre completed high school / ged.
16.0% of adults in Wilkes-Barre completed some college.
10.0% of adults in Wilkes-Barre completed associate's degree.
13.0% of adults in Wilkes-Barre completed bachelor's degree.
5.0% of adults in Wilkes-Barre completed master's degree.
1.0% of adults in Wilkes-Barre completed professional degree.
1.0% of adults in Wilkes-Barre completed doctorate degree.
| Education | Wilkes-Barre | PA | USA |
|---|---|---|---|
| < 9th Grade | 5.0% | 3.0% | 4.0% |
| 9-12th Grade | 10.0% | 5.0% | 6.0% |
| High School / GED | 39.0% | 33.0% | 26.0% |
| Some College | 16.0% | 15.0% | 19.0% |
| Associate's Degree | 10.0% | 9.0% | 9.0% |
| Bachelor's Degree | 13.0% | 21.0% | 22.0% |
| Master's Degree | 5.0% | 10.0% | 10.0% |
| Professional Degree | 1.0% | 2.0% | 2.0% |
| Doctorate Degree | 1.0% | 2.0% | 2.0% |
Household Income For Wilkes-Barre, Pennsylvania
See the full breakdown
8.0% of households in Wilkes-Barre earn Less than $10,000.
5.1% of households in Wilkes-Barre earn $10,000 to $14,999.
11.6% of households in Wilkes-Barre earn $15,000 to $24,999.
9.2% of households in Wilkes-Barre earn $25,000 to $34,999.
17.2% of households in Wilkes-Barre earn $35,000 to $49,999.
18.9% of households in Wilkes-Barre earn $50,000 to $74,999.
10.7% of households in Wilkes-Barre earn $75,000 to $99,999.
12.3% of households in Wilkes-Barre earn $100,000 to $149,999.
3.3% of households in Wilkes-Barre earn $150,000 to $199,999.
3.6% of households in Wilkes-Barre earn $200,000 or more.
| Income | Wilkes-Barre | PA | USA |
|---|---|---|---|
| Less than $10,000 | 8.0% | 4.9% | 5.0% |
| $10,000 to $14,999 | 5.1% | 3.5% | 3.4% |
| $15,000 to $24,999 | 11.6% | 6.7% | 6.3% |
| $25,000 to $34,999 | 9.2% | 6.9% | 6.6% |
| $35,000 to $49,999 | 17.2% | 10.5% | 10.1% |
| $50,000 to $74,999 | 18.9% | 15.9% | 15.5% |
| $75,000 to $99,999 | 10.7% | 12.8% | 12.6% |
| $100,000 to $149,999 | 12.3% | 17.7% | 17.5% |
| $150,000 to $199,999 | 3.3% | 9.3% | 9.6% |
| $200,000 or more | 3.6% | 11.8% | 13.4% |
Source: U.S. Census ACS 5-year estimates (2024)


