
You’re probably never going to make enough money to live in the richest counties in Oklahoma.
The median household income in Mcclain County, the richest county in Oklahoma is $84,552, significantly higher than the US median of $74,580, which means based purely on math most people never make enough to live there.
And that’s okay because it’s still fun to look at the people living in the lap of luxury.
So we used Saturday Night Science and the most recent Census to rank home prices and incomes for all 77 counties in the Sooner State. Let’s star gaze together.
Table Of Contents: Top Ten | Methodology | Table | Summary
The 10 Richest Counties In Oklahoma For 2026
What is the richest county in Oklahoma? The richest county in Oklahoma is Mcclain County. In contrast, the poorest county in state is Harmon County, according to the Census data.
Now you know exactly where to move in Oklahoma. Keep on reading for more about the top ten and a detailed methodology.
Or, check out the best places to live in Oklahoma and the cheapest places to live in Oklahoma.
The Richest Counties In Oklahoma For 2026
1. Mcclain County
Biggest Place: Newcastle
Population: 45,273
Median Income: $84,552 (2nd highest)
Median Home Price: $283,498 (2nd highest)
More on Mcclain County: Data
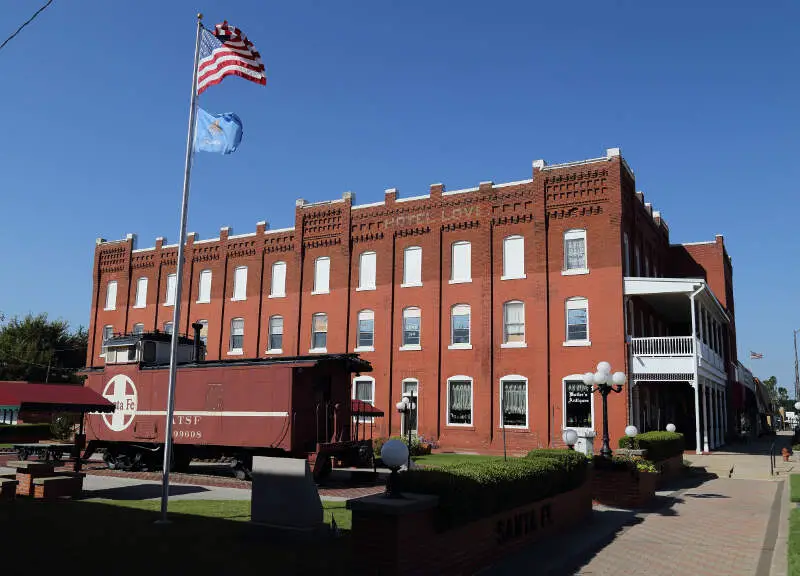
2. Logan County
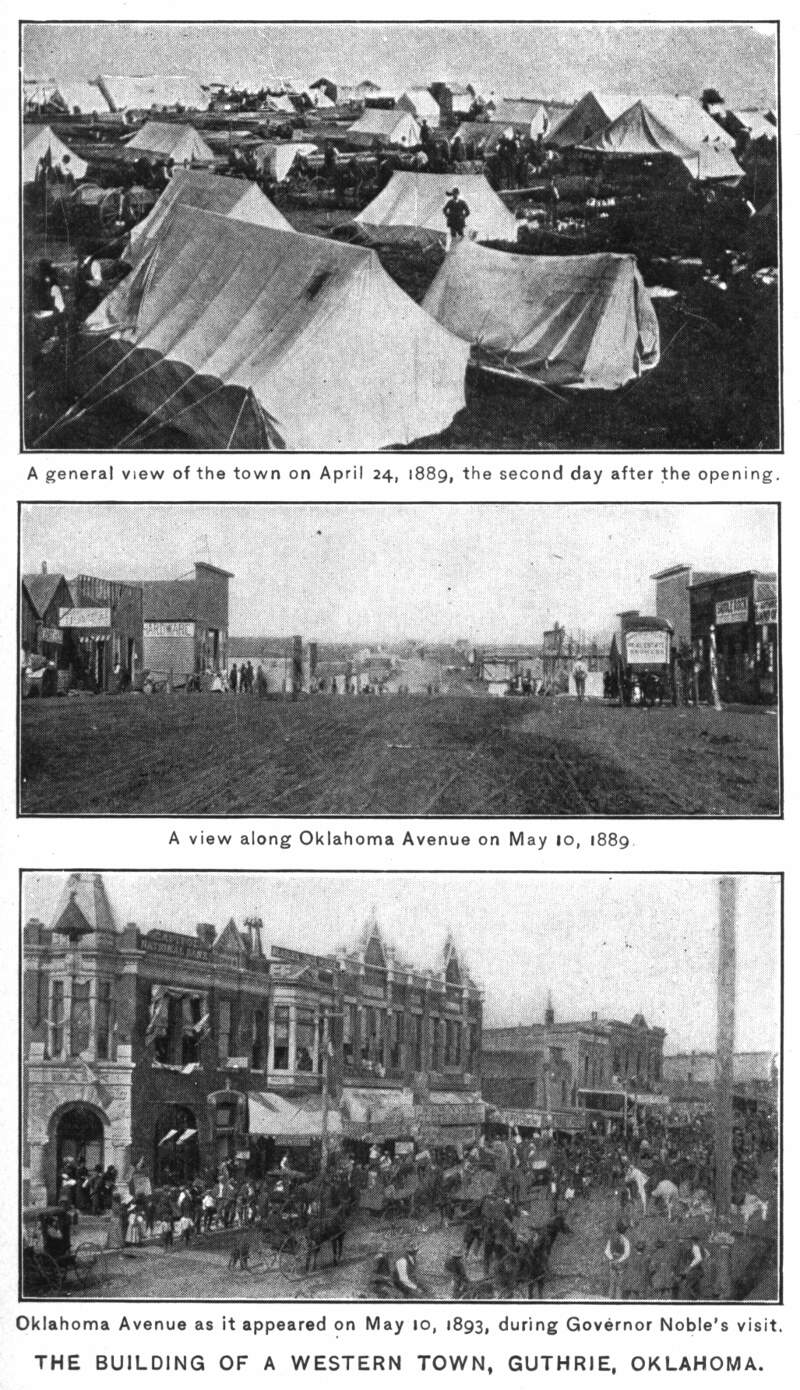
Biggest Place: Guthrie
Population: 51,938
Median Income: $83,899 (3rd highest)
Median Home Price: $310,210 (highest)
More on Logan County: Data
3. Canadian County
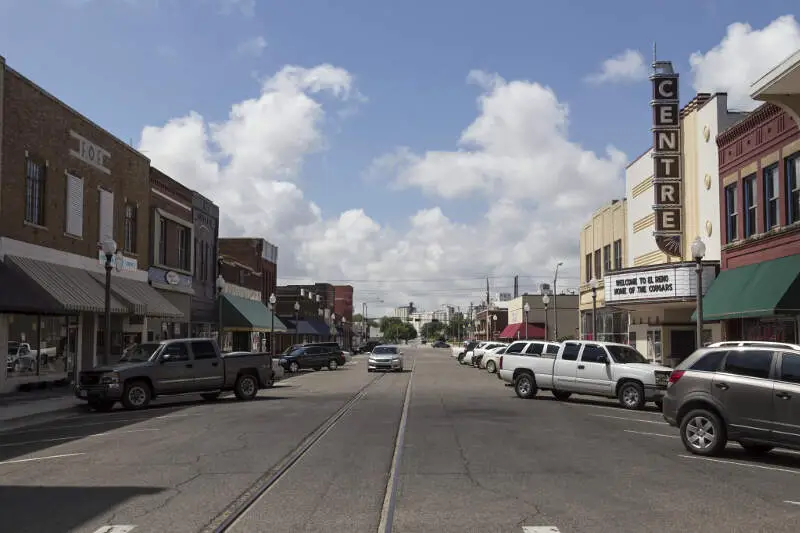
Biggest Place: Oklahoma City
Population: 168,985
Median Income: $87,751 (highest)
Median Home Price: $271,852 (6th highest)
More on Canadian County: Data
4. Wagoner County
Biggest Place: Tulsa
Population: 86,609
Median Income: $81,207 (4th highest)
Median Home Price: $279,885 (4th highest)
More on Wagoner County: Data
5. Rogers County
Biggest Place: Tulsa
Population: 98,610
Median Income: $80,067 (5th highest)
Median Home Price: $278,995 (5th highest)
More on Rogers County: Data
6. Cleveland County
Biggest Place: Oklahoma City
Population: 300,047
Median Income: $77,068 (6th highest)
Median Home Price: $254,108 (7th highest)
More on Cleveland County: Data
7. Grady County
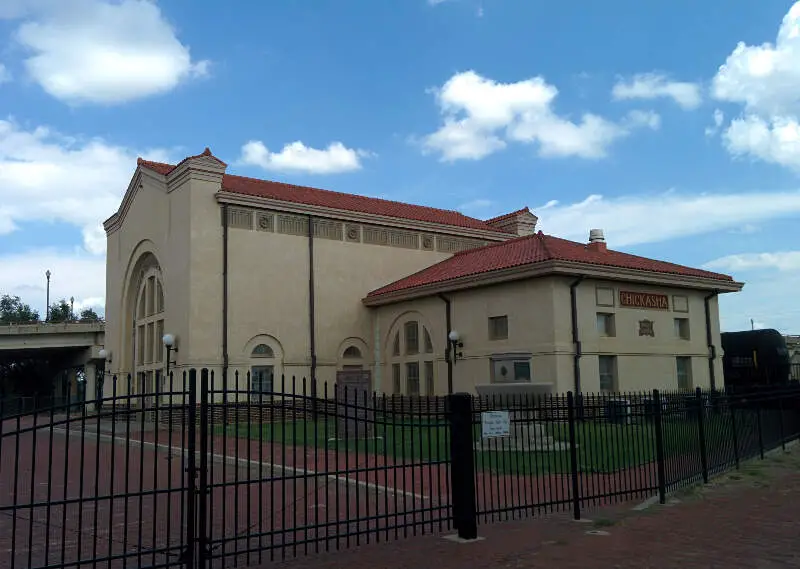
Biggest Place: Chickasha
Population: 56,606
Median Income: $75,419 (7th highest)
Median Home Price: $243,872 (9th highest)
More on Grady County: Data
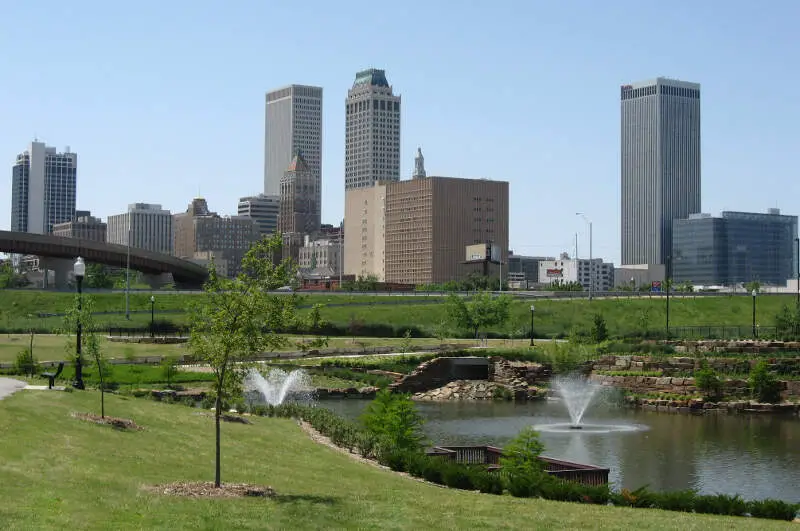
8. Tulsa County
Biggest Place: Tulsa
Population: 680,794
Median Income: $69,009 (10th highest)
Median Home Price: $250,969 (8th highest)
More on Tulsa County: Data
9. Kingfisher County
Biggest Place: Piedmont
Population: 15,430
Median Income: $71,975 (8th highest)
Median Home Price: $228,625 (11th highest)
More on Kingfisher County: Data
10. Oklahoma County
Biggest Place: Oklahoma City
Population: 806,199
Median Income: $66,679 (11th highest)
Median Home Price: $223,511 (13th highest)
More on Oklahoma County: Data
Methodology: How do you determine which Oklahoma county is the richest?
To determine the richest county in Oklahoma, we have to look at a handful of metrics that correlate with how rich people are. To do that, we made assumptions about what makes a county rich. For reference, we are trying to make the kind of argument you’d make at a bar using facts, Saturday Night Science.
With that in mind, we went to the American Community Survey data and Zillow for the most recent reporting period for data on the following:
- Average Home Price
- Median Income
We then ranked each county in Oklahoma for each of the criteria from one to 77, with one being the richest.
Taking the average rank across the two criteria, we created a Rich Score with the county posting the lowest overall score being the “Richest County In Oklahoma.”
The result is some of the places with the most expensive real estate and highest earners in the Sooner State.
We updated this article for 2026. This report is our first time ranking the richest counties to live in Oklahoma. We have also ranked the richest states and richest cities in the United States.
Summary: The Richest Counties In Oklahoma For 2026
Living in Oklahoma can vary from one part of the state to the next, with pretty extreme variance in home prices and incomes across counties.
The richest counties in Oklahoma are McClain County, Logan County, Canadian County, Wagoner County, Rogers County, Cleveland County, Grady County, Tulsa County, Kingfisher County, and Oklahoma County.
Now you know the parts of the state where Goodwill will have the best goodies, and that’s what you came here to learn at the end of the day.
You are welcome.
Here’s a look at the poorest counties in Oklahoma according to the data:
- Harmon County
- Kiowa County
- Tillman County
For more Oklahoma reading, check out:
- Safest Places In Oklahoma
- Richest Cities In Oklahoma
- Best Counties To Live In Oklahoma
- Best Places To Live In Oklahoma
Detailed List Of The Richest Counties In Oklahoma
| Rank | County | Population | Median Income | Average Home Price |
|---|---|---|---|---|
| 1 | Mcclain County | 45,273 | $84,552 | $283,498 |
| 2 | Logan County | 51,938 | $83,899 | $310,210 |
| 3 | Canadian County | 168,985 | $87,751 | $271,852 |
| 4 | Wagoner County | 86,609 | $81,207 | $279,885 |
| 5 | Rogers County | 98,610 | $80,067 | $278,995 |
| 6 | Cleveland County | 300,047 | $77,068 | $254,108 |
| 7 | Grady County | 56,606 | $75,419 | $243,872 |
| 8 | Tulsa County | 680,794 | $69,009 | $250,969 |
| 9 | Kingfisher County | 15,430 | $71,975 | $228,625 |
| 10 | Oklahoma County | 806,199 | $66,679 | $223,511 |
| 11 | Love County | 10,261 | $66,580 | $196,531 |
| 12 | Osage County | 45,997 | $62,847 | $212,533 |
| 13 | Creek County | 72,830 | $62,338 | $213,539 |
| 14 | Roger Mills County | 3,359 | $66,094 | $190,525 |
| 15 | Major County | 7,628 | $71,266 | $163,825 |
| 16 | Pontotoc County | 38,235 | $63,017 | $186,278 |
| 17 | Murray County | 13,753 | $66,322 | $167,636 |
| 18 | Lincoln County | 34,219 | $62,216 | $190,937 |
| 19 | Delaware County | 41,279 | $56,676 | $283,423 |
| 20 | Mayes County | 39,604 | $60,305 | $214,223 |
| 21 | Pottawatomie County | 73,463 | $61,398 | $193,286 |
| 22 | Noble County | 10,897 | $66,365 | $153,667 |
| 23 | Bryan County | 48,253 | $57,225 | $226,172 |
| 24 | Atoka County | 14,379 | $54,785 | $216,054 |
| 25 | Marshall County | 15,792 | $57,245 | $204,181 |
| 26 | Washington County | 53,326 | $60,162 | $181,475 |
| 27 | Garfield County | 62,146 | $66,182 | $141,163 |
| 28 | Carter County | 48,555 | $60,723 | $175,046 |
| 29 | Beaver County | 5,028 | $64,276 | $141,508 |
| 30 | Custer County | 28,259 | $59,738 | $177,100 |
| 31 | Pawnee County | 15,795 | $58,738 | $177,257 |
| 32 | Cherokee County | 47,942 | $53,218 | $206,367 |
| 33 | Texas County | 20,774 | $60,069 | $164,949 |
| 34 | Payne County | 82,972 | $49,809 | $240,041 |
| 35 | Comanche County | 121,825 | $60,761 | $153,467 |
| 36 | Mccurtain County | 30,863 | $51,929 | $203,314 |
| 37 | Craig County | 14,302 | $51,922 | $196,075 |
| 38 | Stephens County | 43,551 | $61,620 | $140,531 |
| 39 | Dewey County | 4,360 | $62,569 | $131,201 |
| 40 | Nowata County | 9,435 | $54,333 | $174,334 |
| 41 | Woodward County | 20,158 | $61,417 | $136,509 |
| 42 | Washita County | 10,815 | $63,501 | $104,799 |
| 43 | Jackson County | 24,678 | $62,799 | $111,153 |
| 44 | Garvin County | 25,860 | $58,556 | $149,321 |
| 45 | Alfalfa County | 5,696 | $64,615 | $82,286 |
| 46 | Sequoyah County | 39,860 | $51,093 | $187,928 |
| 47 | Harper County | 3,203 | $64,053 | $78,874 |
| 48 | Muskogee County | 66,444 | $53,619 | $154,981 |
| 49 | Blaine County | 8,570 | $61,642 | $107,344 |
| 50 | Le Flore County | 49,053 | $51,565 | $168,962 |
| 51 | Johnston County | 10,278 | $52,688 | $156,360 |
| 52 | Pittsburg County | 43,561 | $55,310 | $147,672 |
| 53 | Grant County | 4,131 | $60,758 | $111,617 |
| 54 | Beckham County | 22,148 | $53,328 | $150,788 |
| 55 | Mcintosh County | 19,400 | $46,281 | $188,314 |
| 56 | Ellis County | 3,683 | $61,016 | $101,242 |
| 57 | Cimarron County | 2,218 | $62,188 | $74,095 |
| 58 | Adair County | 19,575 | $48,041 | $171,380 |
| 59 | Kay County | 43,625 | $58,423 | $112,217 |
| 60 | Okmulgee County | 36,899 | $54,029 | $131,437 |
| 61 | Cotton County | 5,485 | $58,425 | $106,640 |
| 62 | Haskell County | 11,683 | $49,806 | $152,477 |
| 63 | Pushmataha County | 10,790 | $47,940 | $154,925 |
| 64 | Greer County | 5,489 | $59,406 | $71,503 |
| 65 | Woods County | 8,596 | $53,275 | $113,744 |
| 66 | Okfuskee County | 11,278 | $48,363 | $148,012 |
| 67 | Ottawa County | 30,341 | $49,947 | $137,118 |
| 68 | Caddo County | 26,447 | $55,353 | $97,171 |
| 69 | Coal County | 5,320 | $50,423 | $131,717 |
| 70 | Hughes County | 13,389 | $51,581 | $116,879 |
| 71 | Latimer County | 9,518 | $41,405 | $141,925 |
| 72 | Choctaw County | 14,297 | $44,081 | $137,080 |
| 73 | Seminole County | 23,494 | $48,062 | $120,902 |
| 74 | Jefferson County | 5,380 | $48,668 | $95,197 |
| 75 | Tillman County | 6,910 | $48,939 | $57,724 |
| 76 | Kiowa County | 8,383 | $44,962 | $74,050 |
| 77 | Harmon County | 2,406 | $43,333 | $65,630 |