Illinois will always be as lucky and wealthy as a lottery winner because they house the Chicago Bears. However, there is more to Illinois than just its great sports teams: there are super wealthy cities in the Land of Lincoln that placate the rich and famous.
You can stop your search if you’re looking for safe cities and neighborhoods, amazing schools, and high-end shopping with a bank account to match. The cities in our top ten Richest Cities in Illinois have these 5-star amenities, and then some. They are mainly centralized around Chi-town.
Cities on our list, like Glencoe, offer beachfront access to Lake Michigan, and cities like Deerfield provide upscale golf courses enough to play a different course every day of the week. Now, it’s not lost on us that there are multiple cities on our ten best cities to live in Illinois for 2026 that are also on our richest list.
Wealthy cities tend to have it all.
$250,001 median income · 1.6% poverty · #2 income in Illinois
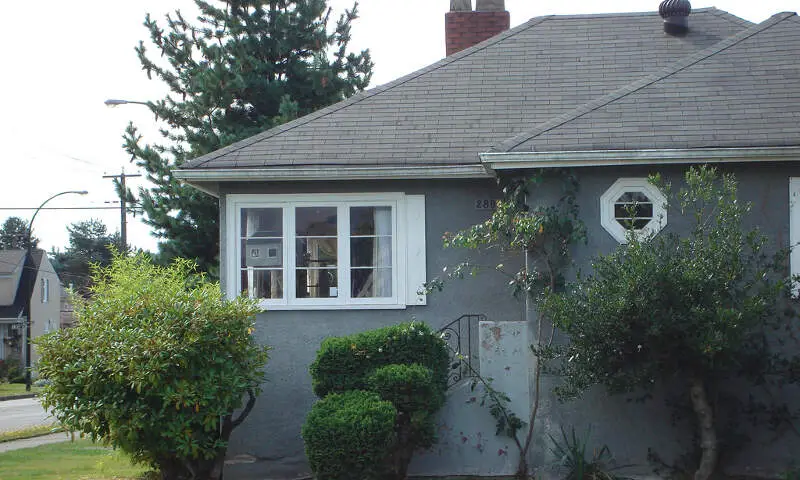
Winnetka is a village in Cook County, Illinois, United States, located 16 miles north of downtown Chicago. The population was 12,187 at the 2010 census. The village is one of the wealthiest places in the nation in terms of household income, and the richest in Illinois.
Data | Crime | Cost of living | Movers
$250,001 median income · 2.9% poverty · #2 income in Illinois
Data | Crime | Cost of living | Movers
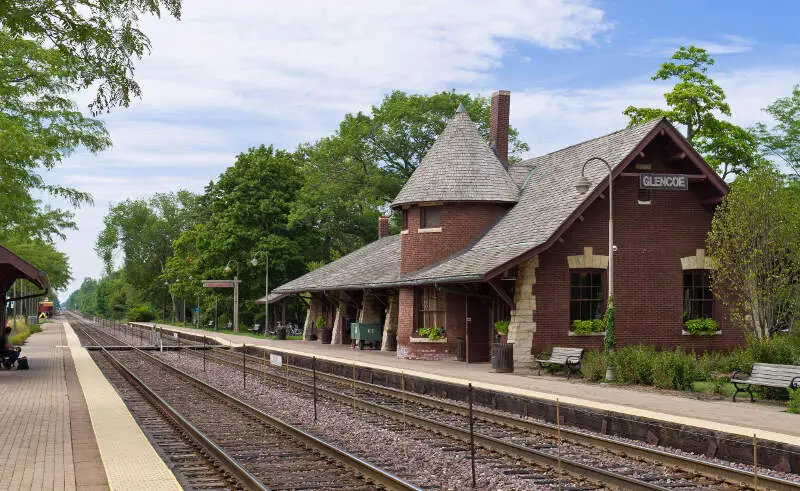
$248,933 median income · 2.1% poverty · #6 income in Illinois
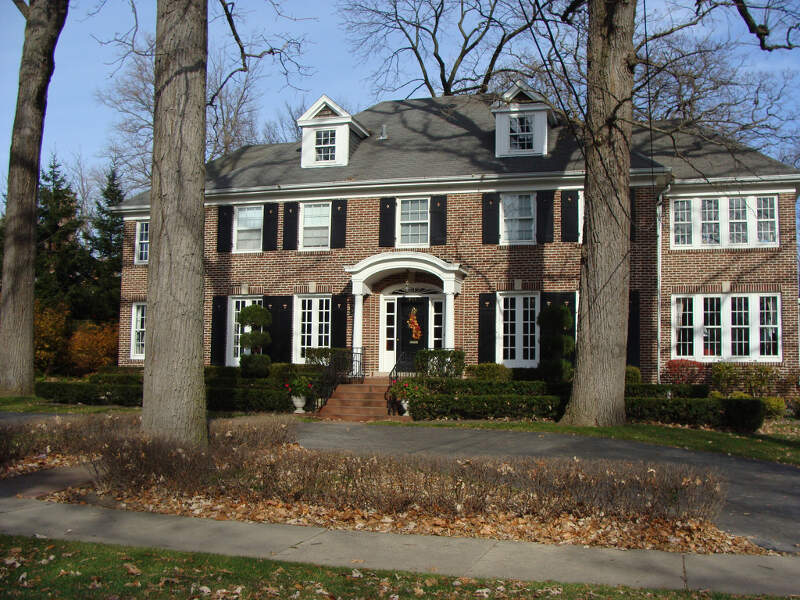
Glencoe is a village in northeastern Cook County, Illinois, United States. As of the 2010 census, the total population was 8,723. Glencoe is located on Chicago’s North Shore and is located within the New Trier High School District.
Data | Crime | Cost of living | Movers
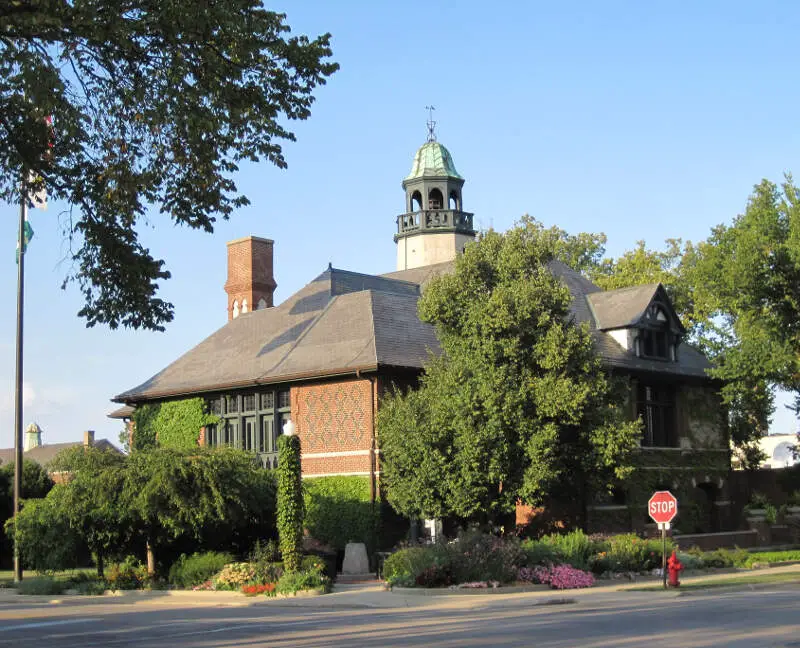
$235,081 median income · 3.5% poverty · #7 income in Illinois
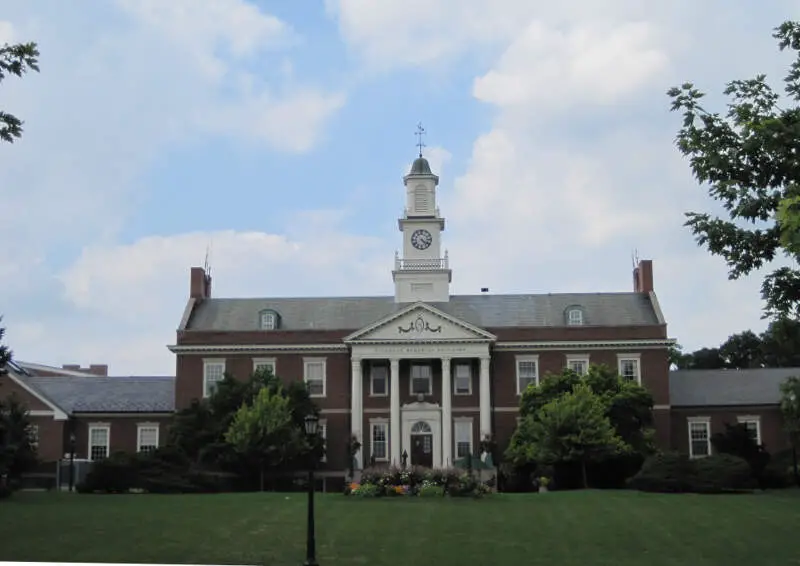
Lake Forest is a city located in Lake County, Illinois, United States. As of the 2010 census it had a population of 19,375. The city is along the shore of Lake Michigan, and is a part of the Chicago metropolitan area and the North Shore. Lake Forest was founded around Lake Forest College and was laid out as a town in 1857 as a stop for travelers making their way south to Chicago. The Lake Forest City Hall, designed by Charles Sumner Frost, was completed in 1898 and originally housed the fire department, the Lake Forest Library, and city offices. Lake Forest is among the wealthiest cities in the United States.
Data | Crime | Cost of living | Movers
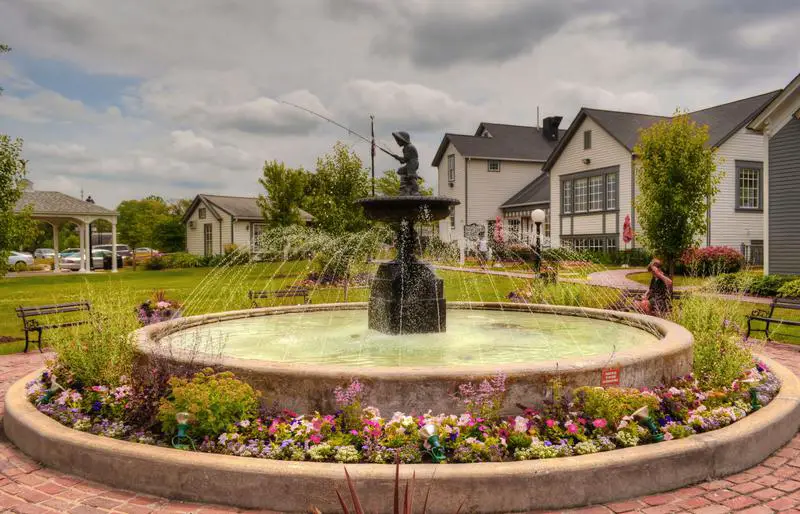
$250,001 median income · 1.2% poverty · #2 income in Illinois
Long Grove is an affluent village in Lake County, Illinois, United States, approximately 35 miles northwest of Chicago. As of the 2010 census, the village had a population of 8,043. The village has strict building ordinances to preserve its “country atmosphere”.
Data | Crime | Cost of living | Movers
$249,205 median income · 0.7% poverty · #5 income in Illinois
Data | Crime | Cost of living | Movers
$221,575 median income · 1.0% poverty · #10 income in Illinois
Data | Crime | Cost of living | Movers
$250,001 median income · 1.0% poverty · #2 income in Illinois
Data | Crime | Cost of living | Movers
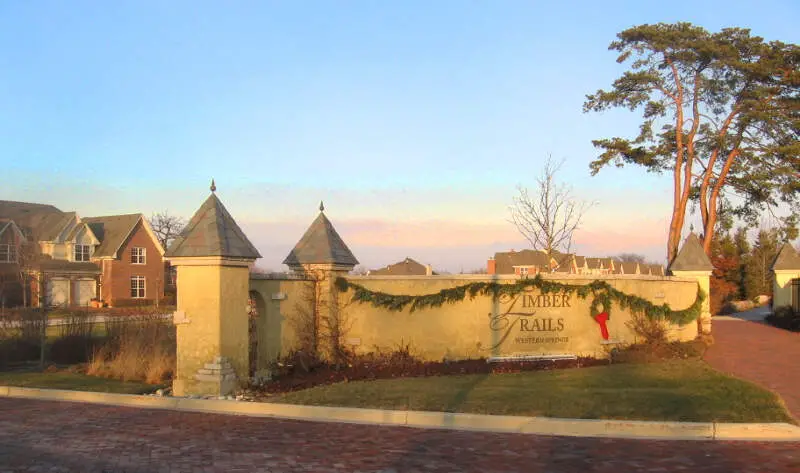
$230,255 median income · 1.3% poverty · #8 income in Illinois
Western Springs is a village located in Cook County, Illinois, United States and is a suburb of Chicago. As of the 2010 census, the village had a total population of 12,975. It is twinned with Rugeley, United Kingdom.
Data | Crime | Cost of living | Movers
$205,074 median income · 8.2% poverty · #14 income in Illinois
Data | Crime | Cost of living | Movers
The receipts
Compare the top ten
Pick a metric. The bars rescale. The red line is Illinois’s statewide median.
Illinois statewide median: $83,390
Illinois statewide median: $285,736
Illinois statewide median: 11.8%
Illinois statewide median: 5.8%
On the map
Where the money lives in Illinois
Saturday Night Science
How we determined the richest places in Illinois for 2026
The first thing most people reach for is personal income. After all, rich people have really high salaries. But one statistic doesn’t capture what it means to be one of the “richest places,” so we applied Saturday Night Science to two measures from the 2020-2024 American Community Survey:
- Median household income
- Median home value
Median household income is the most digestible way to understand how rich a place is, and home values are a measure of accumulated wealth. The two combine to define a “Rich City.”
After collecting the data for all 412 places in Illinois with more than 3,000 people, we ranked each place from 1 to 412 on both criteria, then averaged the two ranks into a “Rich Score.” The place with the lowest Rich Score, Winnetka, is crowned the richest city in Illinois for 2026.
The full plate
All 100 richest cities in Illinois, ranked
Click any column to sort. Search by city name.
| Rank | City | Rich Score | Population | Median income | Median home value | Poverty | Unemployment |
|---|---|---|---|---|---|---|---|
| 1 | Winnetka | 1.75 | 12,484 | $250,001 | $1,818,305 | 1.6% | 3.4% |
| 2 | Hinsdale | 2.75 | 17,175 | $250,001 | $1,244,308 | 2.9% | 3.2% |
| 3 | Glencoe | 4.00 | 8,701 | $248,933 | $1,577,965 | 2.1% | 3.6% |
| 4 | Lake Forest | 5.50 | 19,416 | $235,081 | $1,167,578 | 3.5% | 1.8% |
| 5 | Long Grove | 6.25 | 8,305 | $250,001 | $924,481 | 1.2% | 2.1% |
| 6 | Riverwoods | 7.00 | 4,013 | $249,205 | $949,531 | 0.7% | 0.7% |
| 7 | South Barrington | 7.50 | 5,021 | $221,575 | $1,108,365 | 1.0% | 2.0% |
| 8 | Kildeer | 7.75 | 4,292 | $250,001 | $837,454 | 1.0% | 5.9% |
| 9 | Western Springs | 9.50 | 13,446 | $230,255 | $863,783 | 1.3% | 3.1% |
| 10 | Barrington Hills | 10.00 | 3,879 | $205,074 | $1,020,851 | 8.2% | 3.0% |
| 11 | North Barrington | 12.00 | 3,143 | $226,055 | $821,486 | 4.8% | 3.4% |
| 12 | Wilmette | 12.00 | 27,503 | $190,662 | $961,183 | 3.2% | 4.2% |
| 13 | Oak Brook | 13.00 | 8,056 | $175,870 | $966,776 | 6.6% | 10.0% |
| 14 | Inverness | 14.50 | 7,275 | $207,434 | $787,210 | 2.6% | 3.3% |
| 15 | Hawthorn Woods | 15.50 | 9,143 | $219,631 | $727,356 | 0.6% | 5.7% |
| 16 | Campton Hills | 18.00 | 10,877 | $209,134 | $666,624 | 2.9% | 5.0% |
| 17 | Northfield | 18.00 | 5,487 | $161,500 | $841,446 | 3.2% | 2.2% |
| 18 | Deer Park | 19.00 | 3,711 | $174,458 | $743,157 | 1.3% | 2.3% |
| 19 | Lincolnshire | 19.50 | 7,980 | $185,580 | $714,055 | 5.2% | 2.2% |
| 20 | Highland Park | 19.50 | 30,398 | $168,094 | $751,001 | 4.2% | 3.2% |
| 21 | Burr Ridge | 21.00 | 11,141 | $156,829 | $828,471 | 3.9% | 3.4% |
| 22 | Lake Bluff | 22.00 | 6,041 | $204,000 | $633,530 | 1.5% | 4.4% |
| 23 | Deerfield | 23.00 | 19,518 | $181,660 | $635,444 | 2.8% | 2.7% |
| 24 | Northbrook | 25.00 | 34,585 | $157,782 | $688,265 | 4.3% | 3.2% |
| 25 | La Grange | 26.50 | 15,998 | $159,929 | $639,655 | 4.6% | 2.2% |
| 26 | Green Oaks | 27.50 | 4,096 | $147,614 | $730,455 | 6.1% | 6.3% |
| 27 | Libertyville | 28.00 | 20,525 | $165,667 | $603,285 | 4.2% | 2.9% |
| 28 | River Forest | 29.50 | 11,992 | $146,786 | $716,652 | 2.7% | 8.1% |
| 29 | Naperville | 30.50 | 150,692 | $155,105 | $610,454 | 4.4% | 4.5% |
| 30 | Elmhurst | 32.00 | 45,671 | $149,644 | $613,207 | 3.3% | 4.3% |
| 31 | Barrington | 32.50 | 11,077 | $147,989 | $613,360 | 4.6% | 2.8% |
| 32 | Glenview | 34.00 | 47,752 | $143,056 | $663,147 | 6.0% | 3.4% |
| 33 | Riverside | 34.00 | 9,039 | $153,686 | $547,998 | 3.3% | 1.9% |
| 34 | Frankfort | 38.00 | 20,651 | $154,375 | $487,132 | 3.2% | 4.1% |
| 35 | Park Ridge | 39.00 | 38,667 | $142,986 | $564,905 | 2.9% | 4.2% |
| 36 | Geneva | 40.00 | 21,258 | $144,341 | $532,206 | 3.8% | 1.8% |
| 37 | Clarendon Hills | 41.00 | 8,659 | $130,388 | $666,351 | 8.4% | 3.2% |
| 38 | Glen Ellyn | 41.00 | 28,390 | $140,938 | $562,204 | 6.3% | 5.3% |
| 39 | Lake Barrington | 42.00 | 5,442 | $141,958 | $534,063 | 6.3% | 5.9% |
| 40 | Sleepy Hollow | 42.00 | 3,161 | $149,813 | $460,164 | 4.7% | 5.1% |
| 41 | Homer Glen | 45.00 | 24,529 | $136,678 | $505,179 | 4.3% | 4.6% |
| 42 | Lake Zurich | 47.00 | 19,832 | $135,968 | $488,103 | 3.4% | 3.2% |
| 43 | Wadsworth | 50.50 | 3,686 | $142,738 | $449,330 | 8.5% | 13.3% |
| 44 | Lemont | 50.50 | 17,820 | $123,370 | $565,404 | 3.1% | 4.5% |
| 45 | Winfield | 52.00 | 10,095 | $135,795 | $456,207 | 3.2% | 5.6% |
| 46 | New Lenox | 55.00 | 28,006 | $140,865 | $440,656 | 1.5% | 2.9% |
| 47 | Plainfield | 55.50 | 46,708 | $144,000 | $421,481 | 4.2% | 3.8% |
| 48 | Palos Park | 56.00 | 4,816 | $121,696 | $530,826 | 8.5% | 4.7% |
| 49 | Gilberts | 57.00 | 8,606 | $146,333 | $409,641 | 5.5% | 3.7% |
| 50 | Elburn | 60.00 | 6,354 | $127,731 | $448,721 | 5.4% | 0.5% |
| 51 | Bartlett | 60.50 | 40,501 | $133,240 | $430,326 | 4.2% | 2.6% |
| 52 | Wheaton | 61.00 | 53,557 | $120,008 | $501,273 | 5.6% | 3.7% |
| 53 | La Grange Park | 61.50 | 13,447 | $120,408 | $480,916 | 4.9% | 3.3% |
| 54 | Buffalo Grove | 62.00 | 42,891 | $129,395 | $436,990 | 7.2% | 2.7% |
| 55 | Mokena | 62.50 | 20,021 | $123,889 | $443,959 | 4.5% | 4.1% |
| 56 | Algonquin | 64.50 | 30,067 | $134,525 | $406,940 | 4.1% | 4.1% |
| 57 | Vernon Hills | 64.50 | 26,876 | $121,943 | $448,031 | 6.1% | 3.2% |
| 58 | Spring Grove | 65.50 | 5,917 | $134,210 | $406,655 | 1.4% | 7.3% |
| 59 | Sugar Grove | 66.50 | 9,240 | $121,207 | $445,737 | 4.7% | 5.3% |
| 60 | Batavia | 66.50 | 27,151 | $120,056 | $453,319 | 5.5% | 2.5% |
| 61 | Downers Grove | 66.50 | 50,054 | $115,114 | $494,151 | 5.5% | 4.0% |
| 62 | Arlington Heights | 67.50 | 76,005 | $116,723 | $470,945 | 6.0% | 3.5% |
| 63 | Volo | 68.50 | 6,706 | $160,792 | $366,347 | 2.1% | 2.6% |
| 64 | Oswego | 69.00 | 36,375 | $123,792 | $416,738 | 2.6% | 2.6% |
| 65 | St. Charles | 71.00 | 32,854 | $114,300 | $463,142 | 4.4% | 4.1% |
| 66 | Lincolnwood | 72.00 | 13,112 | $109,731 | $542,075 | 6.3% | 7.8% |
| 67 | Shorewood | 74.50 | 18,343 | $122,105 | $403,278 | 5.2% | 6.6% |
| 68 | Manhattan | 76.00 | 11,026 | $128,522 | $385,490 | 4.2% | 1.5% |
| 69 | Itasca | 77.25 | 9,355 | $114,294 | $443,025 | 2.0% | 2.6% |
| 70 | Oak Park | 78.50 | 53,292 | $110,820 | $458,455 | 7.4% | 5.6% |
| 71 | Darien | 79.00 | 21,879 | $111,215 | $449,623 | 4.2% | 3.9% |
| 72 | Johnsburg | 81.00 | 6,386 | $121,023 | $393,344 | 12.1% | 2.7% |
| 73 | Highwood | 82.00 | 5,301 | $107,875 | $467,497 | 16.0% | 6.0% |
| 74 | Morton Grove | 85.00 | 24,619 | $111,116 | $430,051 | 7.3% | 4.4% |
| 75 | South Elgin | 86.50 | 24,217 | $127,203 | $366,632 | 6.4% | 3.1% |
| 76 | North Aurora | 88.00 | 18,696 | $114,305 | $395,208 | 6.3% | 5.5% |
| 77 | Lindenhurst | 90.50 | 14,417 | $131,474 | $347,218 | 4.1% | 6.7% |
| 78 | Channahon | 92.00 | 13,927 | $119,494 | $374,127 | 5.9% | 7.4% |
| 79 | Sherman | 92.00 | 4,386 | $148,906 | $324,534 | 2.2% | 2.6% |
| 80 | Lisle | 92.50 | 23,407 | $107,479 | $425,025 | 5.9% | 4.2% |
| 81 | Lake Villa | 94.00 | 8,683 | $118,750 | $370,654 | 3.2% | 4.9% |
| 82 | Gurnee | 94.50 | 30,510 | $119,628 | $368,528 | 5.2% | 4.8% |
| 83 | Lake in the Hills | 95.50 | 28,800 | $117,151 | $369,917 | 4.1% | 5.9% |
| 84 | Yorkville | 96.50 | 23,617 | $108,513 | $399,862 | 3.3% | 3.6% |
| 85 | Fox River Grove | 96.50 | 4,523 | $121,506 | $351,812 | 3.7% | 5.8% |
| 86 | West Dundee | 98.00 | 7,906 | $105,368 | $411,113 | 3.3% | 3.3% |
| 87 | Flossmoor | 98.00 | 9,391 | $133,663 | $327,346 | 5.4% | 11.6% |
| 88 | Mount Prospect | 98.00 | 55,472 | $101,720 | $433,814 | 6.6% | 3.8% |
| 89 | Bloomingdale | 98.50 | 22,457 | $102,928 | $428,844 | 5.5% | 4.6% |
| 90 | Palos Heights | 98.50 | 12,152 | $108,740 | $389,153 | 5.2% | 3.6% |
| 91 | Pingree Grove | 99.75 | 10,914 | $114,294 | $369,702 | 1.2% | 3.7% |
| 92 | Roselle | 100.00 | 22,752 | $111,318 | $374,678 | 4.1% | 6.8% |
| 93 | Minooka | 100.50 | 12,891 | $115,445 | $364,409 | 2.6% | 4.2% |
| 94 | Cary | 101.50 | 17,923 | $113,026 | $368,573 | 4.8% | 5.0% |
| 95 | Evanston | 102.00 | 76,340 | $96,434 | $470,774 | 11.8% | 6.2% |
| 96 | Olympia Fields | 102.00 | 4,734 | $123,875 | $328,552 | 13.7% | 5.9% |
| 97 | Hoffman Estates | 102.50 | 51,175 | $106,806 | $394,618 | 7.1% | 4.2% |
| 98 | Mundelein | 103.50 | 31,915 | $108,340 | $380,533 | 8.2% | 2.6% |
| 99 | Grayslake | 104.50 | 20,929 | $113,972 | $361,376 | 6.3% | 5.4% |
| 100 | Orland Hills | 104.50 | 6,719 | $122,039 | $327,784 | 6.4% | 6.1% |
Source: U.S. Census ACS 2020-2024, Zillow research. 412 cities with more than 3,000 residents.
Winnetka is the richest place in Illinois for 2026
When we set out to identify the richest places in Illinois, we weren’t sure what we’d find, but it ended up being some of the best places to live in the state. The richest cities in Illinois are Winnetka, Hinsdale, and Glencoe, and when you look at the data they sit at the very top of the income ladder for everyone who lives there.
Breaking into the top ten takes a median household income of at least $205,074. If you’re curious about the other end of the ledger, the poorest places are listed to the right.