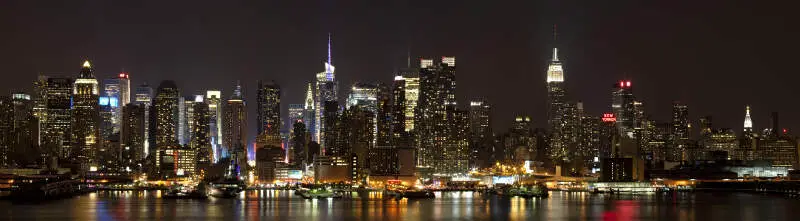
Every city has safe neighborhoods and dangerous neighborhhods. We believe you should know which neighborhoods in New York City are the safest before you move.
Every year, more than 30 million Americans move. Sometimes, its for a job, other times its to escape the big city. But no matter where you move, you want a neighborhood thats family friendly, clean, and most importantly, safe.
Weve analyzed the FBI crime reports data on violent and property crimes for every single neighborhood in New York City. Then, we calculated your chances of being the victim of a crime in each one.
What New York City neighborhoods can you leave your doors unlocked at night? Heres the list.
Which neighborhood is the safest in New York City in 2025? That would be Clearview. Thats according to the most recent FBI crime data, which takes into account everything from thefts and robberies to assaults and murders.
If you dont see a neighborhood youre looking for in our top , scroll down to the bottom, where we have all New York City neighborhoods listed in order from safest to most dangerous.
For more New York reading, check out:
- Safest Cities To Live In America
- Safest States To Live In America
- Worst neighborhoods in New York City
- Best neighborhoods to live in New York City.
Table Of Contents: Top 10 | Methodology | Summary | Table
The 10 Safest Neighborhoods To Live In New York City For 2025
1. Clearview
/10
Population: 28,704
Violent Crimes Per 100k: 168
Property Crime Per 100k: 1,041
2. Carnegie Hill
/10
Population: 13,630
Violent Crimes Per 100k: 118
Property Crime Per 100k: 1,439
3. North Sutton Area
/10
Population: 17,279
Violent Crimes Per 100k: 130
Property Crime Per 100k: 1,327
4. Charlestown-Richmond Valley
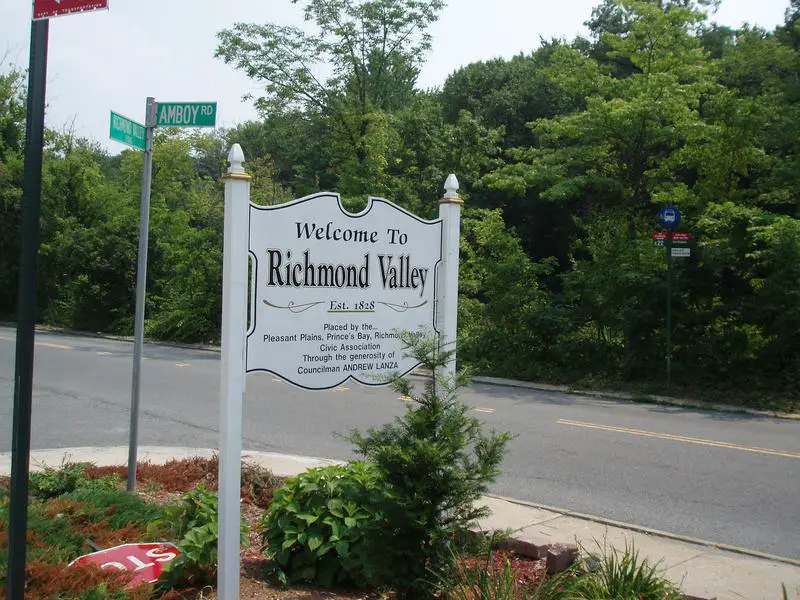
/10
Population: 1,829
Violent Crimes Per 100k: 176
Property Crime Per 100k: 1,470
5. Maspeth
/10
Population: 55,134
Violent Crimes Per 100k: 247
Property Crime Per 100k: 1,190
6. City Island
/10
Population: 4,322
Violent Crimes Per 100k: 242
Property Crime Per 100k: 1,281
7. Dyker Heights
/10
Population: 36,602
Violent Crimes Per 100k: 218
Property Crime Per 100k: 1,339
8. Spuyten Duyvil
/10
Population: 16,320
Violent Crimes Per 100k: 108
Property Crime Per 100k: 2,122
9. Battery Park
/10
Population: 15,714
Violent Crimes Per 100k: 169
Property Crime Per 100k: 1,671
10. Middle Village
/10
Population: 34,717
Violent Crimes Per 100k: 259
Property Crime Per 100k: 1,531
Methodology: How We Determined The Safest New York City Hoods In 2025
You can ask people which neighborhoods are the safest, or you can look at the unbiased raw data. We choose data.
Instead of relying on speculation and opinion, we used Saturday Night Science to analyze the numbers from the FBI’s most recent crime report for every neighborhood in New York City.
To be more specific, we analyzed the FBI’s Uniform Crime Report. We then ran an analysis to calculate each neighborhood’s property and violent crimes per capita. We used the following criteria:
- Total Crimes Per Capita
- Violent Crimes Per Capita
- Property Crimes Per Capita
We then ranked each neighborhood with scores from 1 to 123 in each category, where 1 was the safest.
Next, we averaged the rankings for each neighborhood to create a safe neighborhood index.
Finally, we crowned the neighborhood with the lowest safest neighborhood index the “Safest City Neighborhood In New York City.” We’re lookin’ at you, Clearview.
We updated this article for 2025. This is our fourth time ranking the safest neighborhoods in New York City.
Skip to the end to see the list of all the neighborhoods in the city, from safest to most expensive.
Summary: The Safest Places In New York City
Looking at the data, you can tell that Clearview is as safe as they come, according to science and data.
The safest neighborhoods in New York City are Clearview, Carnegie Hill, North Sutton Area, Charlestown-Richmond Valley, Maspeth, City Island, Dyker Heights, Spuyten Duyvil, Battery Park, and Middle Village.
But as most New York residents would agree, almost every place here has its safe and not safe parts. So make sure you’re informed ahead of time.
The most dangerous neighborhoods in New York City are Greenwich Village, Chelsea, Financial District, West Village, and Ardon Heights.
We ranked the neighborhoods from safest to most dangerous in the chart below.
For more New York reading, check out:
- Best Places To Live In New York
- Cheapest Places To Live In New York
- Most Dangerous Places In New York
- Richest Cities In New York
- Safest Places In New York According To Science
- Worst Places To Live In New York State
Detailed List Of The Safest Neighborhoods To Live In New York City For 2025
| Rank | Neighborhood | Crime Per 100K |
|---|---|---|
| 1 | Clearview | 1,209 |
| 2 | Carnegie Hill | 1,557 |
| 3 | North Sutton Area | 1,457 |
| 4 | Charlestown-Richmond Valley | 1,646 |
| 5 | Maspeth | 1,437 |
| 6 | City Island | 1,523 |
| 7 | Dyker Heights | 1,557 |
| 8 | Spuyten Duyvil | 2,230 |
| 9 | Battery Park | 1,840 |
| 10 | Middle Village | 1,790 |
| 11 | Douglastown-Little Neck | 1,697 |
| 12 | University Heights | 3,186 |
| 13 | Auburndale | 2,123 |
| 14 | Nkew Gardens | 1,839 |
| 15 | Bensonhurst | 1,951 |
| 16 | Gravesend-Sheepshead Bay | 2,018 |
| 17 | Mapleton-Flatlands | 2,062 |
| 18 | Woodside | 2,092 |
| 19 | Howland Hook | 3,617 |
| 20 | Glendale | 2,213 |
| 21 | Jamaica | 3,688 |
| 22 | Bloomfield-Chelsea-Travis | 2,352 |
| 23 | Saintalbans | 2,117 |
| 24 | Port Richmond | 3,753 |
| 25 | Utopia | 2,361 |
| 26 | Borough Park | 2,394 |
| 27 | Tottensville | 2,649 |
| 28 | Queens Village | 2,249 |
| 29 | Woodhaven-Richmond Hill | 2,261 |
| 30 | Forest Hills | 2,645 |
| 31 | Wakefield-Williamsbridge | 3,800 |
| 32 | Richmondtown | 2,878 |
| 33 | Yorkville | 3,925 |
| 34 | Park Slope | 2,704 |
| 35 | Boerum Hill | 10,898 |
| 36 | Bedford-Stuyvesant | 4,000 |
| 37 | Cobble Hill | 3,114 |
| 38 | Whitestone | 2,647 |
| 39 | Soundview | 4,000 |
| 40 | Baychester | 2,612 |
| 41 | Flatbush | 11 |
| 42 | Hamilton Heights | 4,192 |
| 43 | Ettingville | 1,162 |
| 44 | Eastchester | 4,205 |
| 45 | Queensboro Hill | 1,128 |
| 46 | Midland Beach | 4,328 |
| 47 | Ridgewood | 2,910 |
| 48 | Sunny Side | 2,950 |
| 49 | Westerleigh-Castleton | 1,202 |
| 50 | Morningside Heights | 3,015 |
| 51 | Washington Heights | 2,821 |
| 52 | Williams Bridge | 2,658 |
| 53 | East Harlem | 2,671 |
| 54 | Sunset Park | 2,846 |
| 55 | Upper East Side | 3,190 |
| 56 | Laurelton | 2,865 |
| 57 | Soho | 1,227 |
| 58 | Downtown | 1,227 |
| 59 | Murray Hill | 1,227 |
| 60 | Central Park | 1,227 |
| 61 | Garment District | 1,227 |
| 62 | Midtown | 1,227 |
| 63 | East Brooklyn | 4,551 |
| 64 | Williamsburg | 3,135 |
| 65 | Todt Hill | 5,434 |
| 66 | Morris Heights | 4,666 |
| 67 | Lower East Side | 4,685 |
| 68 | South Beach | 5,459 |
| 69 | Bedford Park | 4,675 |
| 70 | Upper West Side | 3,324 |
| 71 | The Rockaways | 2,986 |
| 72 | Throggs Neck | 3,228 |
| 73 | Harlem | 5,034 |
| 74 | Hunts Point | 12,367 |
| 75 | Mariners Harbor | 3,150 |
| 76 | Greenwood | 3,222 |
| 77 | Inwood | 3,113 |
| 78 | Springfield Gardens | 5,229 |
| 79 | Astoria-Long Island City | 3,217 |
| 80 | Country Club | 3,311 |
| 81 | College Point | 3,330 |
| 82 | Parkchester | 6,107 |
| 83 | Great Kills | 664 |
| 84 | Morris Park | 3,572 |
| 85 | Bay Ridge | 3,703 |
| 86 | Woodlawn-Nordwood | 3,724 |
| 87 | Clinton | 3,535 |
| 88 | Union Port | 3,462 |
| 89 | Rossville | 701 |
| 90 | Riverdale | 4,012 |
| 91 | Gramercy | 8,549 |
| 92 | Chinatown | 6,610 |
| 93 | Corona | 3,669 |
| 94 | Jackson Heights | 6,804 |
| 95 | Fordham | 6,661 |
| 96 | Prince’s Bay | 828 |
| 97 | Fort Green | 3,943 |
| 98 | Steinway | 3,947 |
| 99 | Annandale | 960 |
| 100 | Kings Bridge | 4,515 |
| 101 | Tremont | 7,480 |
| 102 | Bushwick | 4,001 |
| 103 | Huguenot | 862 |
| 104 | New Brighton | 4,019 |
| 105 | Clifton | 4,178 |
| 106 | Flushing | 4,529 |
| 107 | Woodrow | 910 |
| 108 | Little Italy | 6,054 |
| 109 | High Bridge | 9,769 |
| 110 | East Village | 4,627 |
| 111 | Brownsville | 9,130 |
| 112 | Canarsie | 4,510 |
| 113 | Carroll Gardens | 5,701 |
| 114 | South Bronx | 9,488 |
| 115 | Oakwood | 5,300 |
| 116 | Mott Haven | 9,743 |
| 117 | Rosebank | 60 |
| 118 | Tribeca | 6,433 |
| 119 | Ardon Heights | 562 |
| 120 | West Village | 6,216 |
| 121 | Financial District | 7,223 |
| 122 | Chelsea | 7,460 |
| 123 | Greenwich Village | 9,129 |