Walterboro SnackAbility
Overall SnackAbility
Crime in Walterboro summary. We use data from the FBI to determine the crime rates in Walterboro. Key points include:
There were 349 total crimes in Walterboro in the last reporting year.
The overall crime rate per 100,000 people in Walterboro is 6,386.1 / 100k people.
The violent crime rate per 100,000 people in Walterboro is 1,006.4 / 100k people.
The property crime rate per 100,000 people in Walterboro is 5,379.7 / 100k people.
Overall, crime in Walterboro is 201.34% above the national average.
Total Crimes
Above National Average
Crime In Walterboro Comparison Table
| Statistic | Count Raw |
Walterboro / 100k People |
South Carolina / 100k People |
National / 100k People |
|---|---|---|---|---|
| Total Crimes Per 100K | 349 | 6,386.1 | 2,402.5 | 2,119.2 |
| Violent Crime | 55 | 1,006.4 | 436.7 | 359.0 |
| Murder | 2 | 36.6 | 7.5 | 5.0 |
| Robbery | 6 | 109.8 | 35.1 | 61.0 |
| Aggravated Assault | 46 | 841.7 | 357.1 | 256.0 |
| Property Crime | 294 | 5,379.7 | 1,965.8 | 1,760.0 |
| Burglary | 24 | 439.2 | 282.4 | 229.0 |
| Larceny | 253 | 4,629.5 | 1,468.2 | 1,272.0 |
| Car Theft | 17 | 311.1 | 215.1 | 259.0 |
Source: FBI Uniform Crime Reporting (2024)
Cost of living in Walterboro summary. We use data on the cost of living to determine how expensive it is to live in Walterboro. Real estate prices drive most of the variance in cost of living around South Carolina. Key points include:
The cost of living in Walterboro is 87 with 100 being average.
The cost of living in Walterboro is 0.9x lower than the national average.
The median home value in Walterboro is $210,403.
The median income in Walterboro is $56,457.
Walterboro's Overall Cost Of Living
Lower Than The National Average
Cost Of Living In Walterboro Comparison Table
| Living Expense | Walterboro | South Carolina | National Average |
|---|---|---|---|
| Overall | 87 | 92 | 100 |
| Services | 98 | 97 | 100 |
| Groceries | 96 | 96 | 100 |
| Health | 60 | 82 | 100 |
| Housing | 96 | 101 | 100 |
| Transportation | 101 | 101 | 100 |
| Utilities | 101 | 97 | 100 |
Source: Cost of living index, normalized to US average = 100
Walterboro, SC Weather
The average high in Walterboro is 76.9° and the average low is 53.7°.
There are 65.2 days of precipitation each year.
Expect an average of 47.4 inches of precipitation each year with 0.2 inches of snow.
| Stat | Walterboro |
|---|---|
| Average Annual High | 76.9 |
| Average Annual Low | 53.7 |
| Annual Precipitation Days | 65.2 |
| Average Annual Precipitation | 47.4 |
| Average Annual Snowfall | 0.2 |
Average High
Days of Rain
Source: NOAA climate normals (30-year)
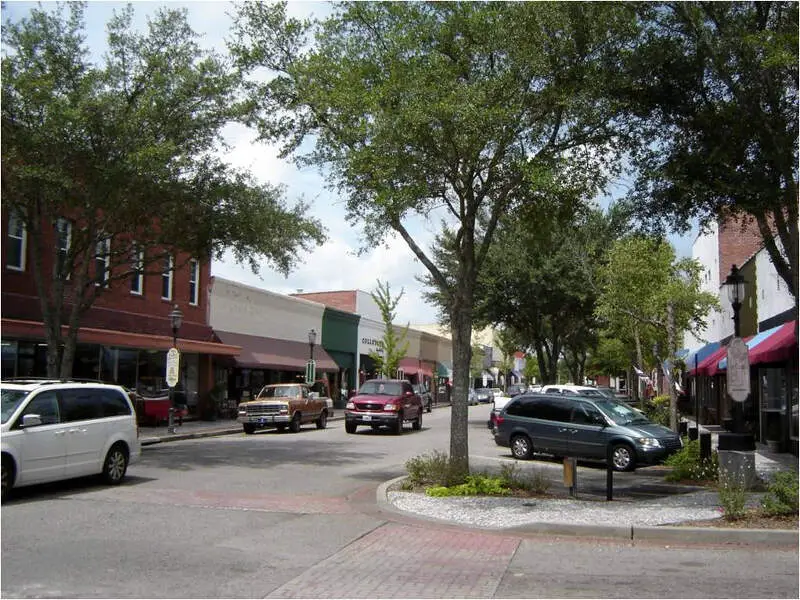
Walterboro, SC Photos

Rankings & Articles For Walterboro


Locations Around Walterboro
Map Of Walterboro, SC
Best Places Around Walterboro
Mount Pleasant, SC
Population 93,993
Charleston, SC
Population 154,338
Hilton Head Island, SC
Population 37,911
Summerville, SC
Population 51,654
Sangaree, SC
Population 8,681
Hanahan, SC
Population 21,452
Ladson, SC
Population 16,140
Goose Creek, SC
Population 48,078
Port Royal, SC
Population 15,579
Burton, SC
Population 6,912
Walterboro Demographics And Statistics
Population over time in Walterboro
The current population in Walterboro is 5,480. The population has increased 1.3% from 2010.
| Year | Population | % Change |
|---|---|---|
| 2024 | 5,480 | -0.2% |
| 2023 | 5,490 | -0.5% |
| 2022 | 5,515 | 0.0% |
| 2021 | 5,514 | 1.8% |
| 2020 | 5,417 | -1.1% |
| 2019 | 5,477 | -0.5% |
| 2018 | 5,503 | 7.0% |
| 2017 | 5,143 | -2.7% |
| 2016 | 5,287 | -0.5% |
| 2015 | 5,312 | -0.5% |
| 2014 | 5,339 | -0.6% |
| 2013 | 5,369 | -0.2% |
| 2012 | 5,382 | -0.6% |
| 2011 | 5,412 | 0.0% |
| 2010 | 5,412 | - |
Race / Ethnicity in Walterboro
See the full breakdown
Walterboro is:
41.5% White with 2,273 White residents.
50.2% African American with 2,750 African American residents.
0.0% American Indian with 0 American Indian residents.
2.7% Asian with 146 Asian residents.
0.0% Hawaiian with 0 Hawaiian residents.
0.0% Other with 0 Other residents.
1.5% Two Or More with 81 Two Or More residents.
4.2% Hispanic with 230 Hispanic residents.
| Race | Walterboro | SC | USA |
|---|---|---|---|
| White | 41.5% | 61.9% | 57.4% |
| African American | 50.2% | 24.6% | 11.9% |
| American Indian | 0.0% | 0.2% | 0.5% |
| Asian | 2.7% | 1.7% | 5.9% |
| Hawaiian | 0.0% | 0.0% | 0.2% |
| Other | 0.0% | 0.5% | 0.6% |
| Two Or More | 1.5% | 3.7% | 4.3% |
| Hispanic | 4.2% | 7.4% | 19.3% |
Gender in Walterboro
See the full breakdown
Walterboro is 61.6% female with 3,378 female residents.
Walterboro is 38.4% male with 2,102 male residents.
| Gender | Walterboro | SC | USA |
|---|---|---|---|
| Female | 61.6% | 51.3% | 50.5% |
| Male | 38.4% | 48.7% | 49.5% |
Highest level of educational attainment in Walterboro for adults over 25
See the full breakdown
3.0% of adults in Walterboro completed < 9th grade.
13.0% of adults in Walterboro completed 9-12th grade.
29.0% of adults in Walterboro completed high school / ged.
19.0% of adults in Walterboro completed some college.
11.0% of adults in Walterboro completed associate's degree.
17.0% of adults in Walterboro completed bachelor's degree.
6.0% of adults in Walterboro completed master's degree.
2.0% of adults in Walterboro completed professional degree.
0.0% of adults in Walterboro completed doctorate degree.
| Education | Walterboro | SC | USA |
|---|---|---|---|
| < 9th Grade | 3.0% | 3.0% | 4.0% |
| 9-12th Grade | 13.0% | 7.0% | 6.0% |
| High School / GED | 29.0% | 28.0% | 26.0% |
| Some College | 19.0% | 20.0% | 19.0% |
| Associate's Degree | 11.0% | 10.0% | 9.0% |
| Bachelor's Degree | 17.0% | 20.0% | 22.0% |
| Master's Degree | 6.0% | 9.0% | 10.0% |
| Professional Degree | 2.0% | 2.0% | 2.0% |
| Doctorate Degree | 0.0% | 1.0% | 2.0% |
Household Income For Walterboro, South Carolina
See the full breakdown
9.4% of households in Walterboro earn Less than $10,000.
14.7% of households in Walterboro earn $10,000 to $14,999.
7.2% of households in Walterboro earn $15,000 to $24,999.
2.1% of households in Walterboro earn $25,000 to $34,999.
8.8% of households in Walterboro earn $35,000 to $49,999.
22.9% of households in Walterboro earn $50,000 to $74,999.
11.3% of households in Walterboro earn $75,000 to $99,999.
15.8% of households in Walterboro earn $100,000 to $149,999.
3.3% of households in Walterboro earn $150,000 to $199,999.
4.5% of households in Walterboro earn $200,000 or more.
| Income | Walterboro | SC | USA |
|---|---|---|---|
| Less than $10,000 | 9.4% | 5.9% | 5.0% |
| $10,000 to $14,999 | 14.7% | 3.8% | 3.4% |
| $15,000 to $24,999 | 7.2% | 7.3% | 6.3% |
| $25,000 to $34,999 | 2.1% | 7.7% | 6.6% |
| $35,000 to $49,999 | 8.8% | 11.9% | 10.1% |
| $50,000 to $74,999 | 22.9% | 17.0% | 15.5% |
| $75,000 to $99,999 | 11.3% | 13.1% | 12.6% |
| $100,000 to $149,999 | 15.8% | 16.4% | 17.5% |
| $150,000 to $199,999 | 3.3% | 8.0% | 9.6% |
| $200,000 or more | 4.5% | 8.9% | 13.4% |
Source: U.S. Census ACS 5-year estimates (2024)


