Chattanooga SnackAbility
Overall SnackAbility
Crime in Chattanooga summary. We use data from the FBI to determine the crime rates in Chattanooga. Key points include:
There were 9,003 total crimes in Chattanooga in the last reporting year.
The overall crime rate per 100,000 people in Chattanooga is 4,766.2 / 100k people.
The violent crime rate per 100,000 people in Chattanooga is 823.7 / 100k people.
The property crime rate per 100,000 people in Chattanooga is 3,942.4 / 100k people.
Overall, crime in Chattanooga is 124.90% above the national average.
Total Crimes
Above National Average
Crime In Chattanooga Comparison Table
| Statistic | Count Raw |
Chattanooga / 100k People |
Tennessee / 100k People |
National / 100k People |
|---|---|---|---|---|
| Total Crimes Per 100K | 9,003 | 4,766.2 | 2,624.4 | 2,119.2 |
| Violent Crime | 1,556 | 823.7 | 592.3 | 359.0 |
| Murder | 24 | 12.7 | 7.9 | 5.0 |
| Robbery | 177 | 93.7 | 58.4 | 61.0 |
| Aggravated Assault | 1,183 | 626.3 | 488.6 | 256.0 |
| Property Crime | 7,447 | 3,942.4 | 2,032.1 | 1,760.0 |
| Burglary | 717 | 379.6 | 251.8 | 229.0 |
| Larceny | 5,471 | 2,896.3 | 1,443.6 | 1,272.0 |
| Car Theft | 1,259 | 666.5 | 336.7 | 259.0 |
Source: FBI Uniform Crime Reporting (2024)
Cost of living in Chattanooga summary. We use data on the cost of living to determine how expensive it is to live in Chattanooga. Real estate prices drive most of the variance in cost of living around Tennessee. Key points include:
The cost of living in Chattanooga is 99 with 100 being average.
The cost of living in Chattanooga is 1.0x lower than the national average.
The median home value in Chattanooga is $319,578.
The median income in Chattanooga is $64,523.
Chattanooga's Overall Cost Of Living
Lower Than The National Average
Cost Of Living In Chattanooga Comparison Table
| Living Expense | Chattanooga | Tennessee | National Average |
|---|---|---|---|
| Overall | 99 | 94 | 100 |
| Services | 95 | 99 | 100 |
| Groceries | 96 | 96 | 100 |
| Health | 95 | 82 | 100 |
| Housing | 96 | 95 | 100 |
| Transportation | 96 | 99 | 100 |
| Utilities | 95 | 98 | 100 |
Source: Cost of living index, normalized to US average = 100
Chattanooga, TN Weather
The average high in Chattanooga is 71.0° and the average low is 48.7°.
There are 81.6 days of precipitation each year.
Expect an average of 53.1 inches of precipitation each year with 2.0 inches of snow.
| Stat | Chattanooga |
|---|---|
| Average Annual High | 71.0 |
| Average Annual Low | 48.7 |
| Annual Precipitation Days | 81.6 |
| Average Annual Precipitation | 53.1 |
| Average Annual Snowfall | 2.0 |
Average High
Days of Rain
Source: NOAA climate normals (30-year)
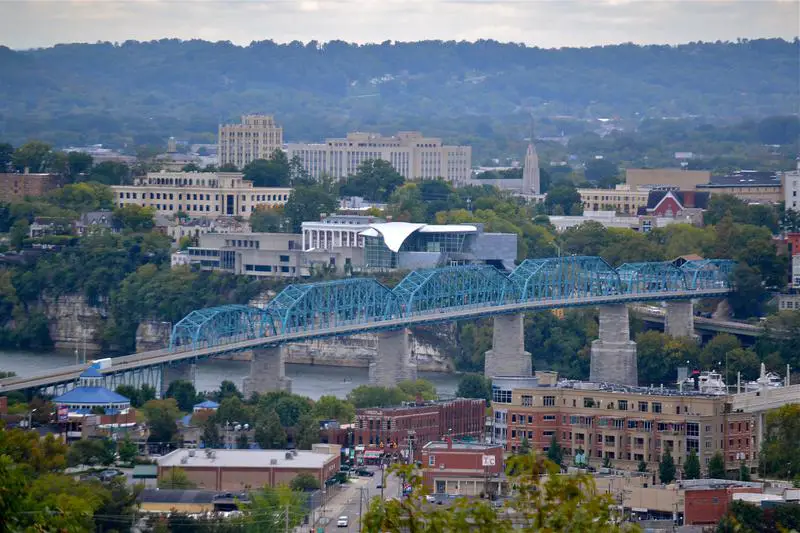
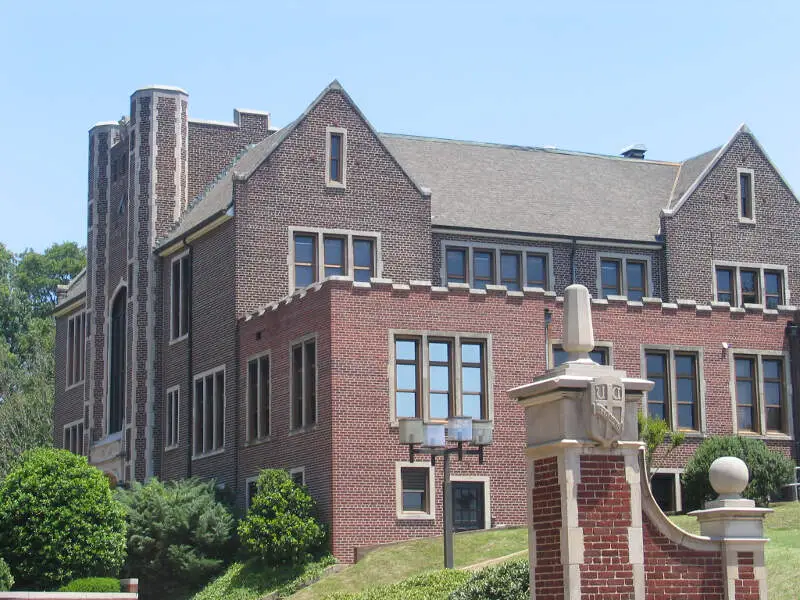
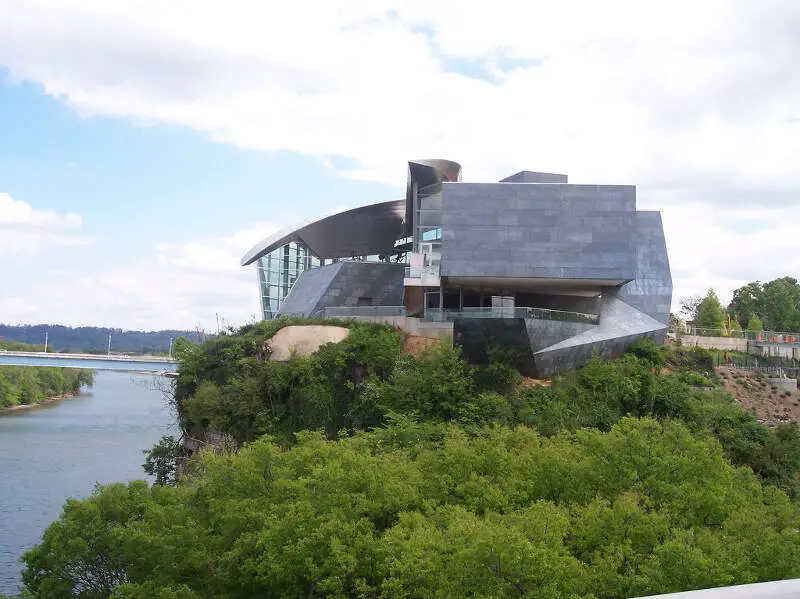
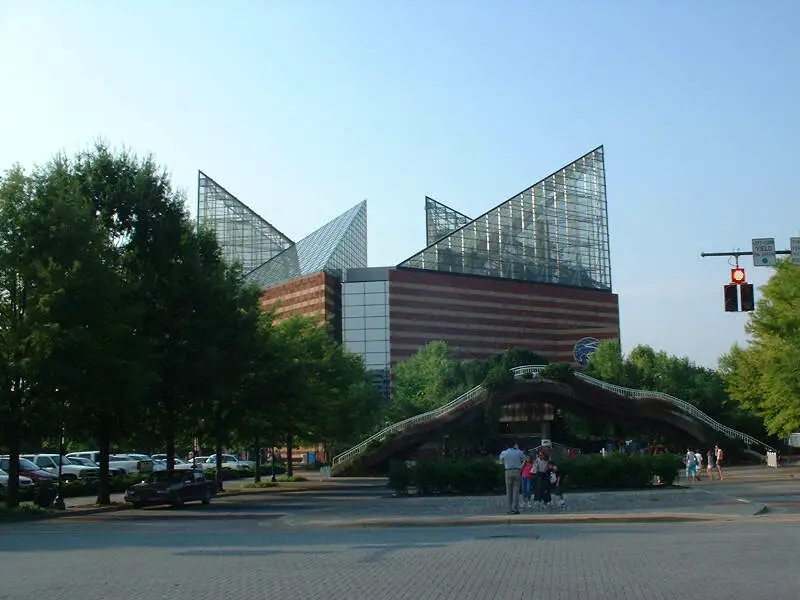
Chattanooga, TN Photos


5 Reviews & Comments About Chattanooga

I live in Chattanooga myself been here for years now.
There are a lot of restaurants, festivals and events throughout the year. Has all the amenities of a larger city but with out all the hassles.
Downtown by the river is always a happening place.
I was in Chattanooga for the eclipse last year and it was a really great experience. We watched the eclipse by the side of the river and it was a once in a lifetime experience.
The Mellow Mushroom has amazing pizza and calzones. The aquarium is wonderful. My favorite is the River Walk. We sat on the steps next to the river at night under a full moon, with a cool fall breeze in the air. Incredible.
I love Chattanooga Tennessee. It's such a amazing City. There's so much to do and great places to eat. We love the Tennessee Aquarium. The city has a small-town feel. We enjoyed riding the transportation system in downtown. One of my favorite places to eat was sticky fingers barbecue. Unbelievably good food. When we go to Chattanooga I we stay in the Sheridan Hotel. It is a great place to stay.
Chattanooga is just a beautiful city. It is so close to the mountains. Awesome river bear by. A lot of attractions in the city. Lookout mountain is not too far off. Rock city is near by. Lots of hiking and camping nearby. It's a great place to visit.
Chattanooga is a big town / small city, but it is growing. The natural surroundings are beautiful, with the Tennessee River flowing right through town and the surrounding hills and mountains. Everyone there seems friendly and there are plenty of things to do. There are many great restaurants and coffee shops. There are live music venues and bars for nightlife. The riverfront area is great for walking or biking outdoors. The aquarium is a very enjoyable attraction and it is affordable and rarely too crowded. The Chattanooga Choo Choo is a neat experience where you can actually book a room to stay in an old railroad sleeping car. Chattanooga is also an easy car trip from several cities like Nashville, Knoxville, Huntsville, and Atlanta.
The Tennessee Aquarium. Tennessee Valley Railroad Museum. Riverboat rides. Antique shopping. Good restaurants. Lookout Mountain. Ruby Falls.
Rankings & Articles For Chattanooga


Locations Around Chattanooga
Map Of Chattanooga, TN
Best Places Around Chattanooga
Signal Mountain, TN
Population 8,860
Middle Valley, TN
Population 12,187
Harrison, TN
Population 8,011
Collegedale, TN
Population 11,330
Fort Oglethorpe, GA
Population 10,416
Fairview, GA
Population 5,302
Soddy-Daisy, TN
Population 13,231
South Cleveland, TN
Population 7,452
Red Bank, TN
Population 12,010
Chattanooga Demographics And Statistics
Population over time in Chattanooga
The current population in Chattanooga is 185,783. The population has increased 13.0% from 2010.
| Year | Population | % Change |
|---|---|---|
| 2024 | 185,783 | 1.6% |
| 2023 | 182,832 | 0.9% |
| 2022 | 181,288 | 0.5% |
| 2021 | 180,353 | -0.6% |
| 2020 | 181,370 | 0.9% |
| 2019 | 179,690 | 1.3% |
| 2018 | 177,365 | 0.6% |
| 2017 | 176,291 | 0.5% |
| 2016 | 175,462 | 0.6% |
| 2015 | 174,483 | 1.5% |
| 2014 | 171,863 | 0.9% |
| 2013 | 170,246 | 1.4% |
| 2012 | 167,869 | 0.9% |
| 2011 | 166,298 | 1.1% |
| 2010 | 164,481 | - |
Race / Ethnicity in Chattanooga
See the full breakdown
Chattanooga is:
55.5% White with 103,085 White residents.
27.6% African American with 51,198 African American residents.
0.0% American Indian with 85 American Indian residents.
2.3% Asian with 4,187 Asian residents.
0.0% Hawaiian with 32 Hawaiian residents.
0.3% Other with 648 Other residents.
4.3% Two Or More with 7,985 Two Or More residents.
10.0% Hispanic with 18,563 Hispanic residents.
| Race | Chattanooga | TN | USA |
|---|---|---|---|
| White | 55.5% | 71.0% | 57.4% |
| African American | 27.6% | 15.4% | 11.9% |
| American Indian | 0.0% | 0.1% | 0.5% |
| Asian | 2.3% | 1.9% | 5.9% |
| Hawaiian | 0.0% | 0.1% | 0.2% |
| Other | 0.3% | 0.4% | 0.6% |
| Two Or More | 4.3% | 3.7% | 4.3% |
| Hispanic | 10.0% | 7.4% | 19.3% |
Gender in Chattanooga
See the full breakdown
Chattanooga is 51.6% female with 95,864 female residents.
Chattanooga is 48.4% male with 89,918 male residents.
| Gender | Chattanooga | TN | USA |
|---|---|---|---|
| Female | 51.6% | 50.9% | 50.5% |
| Male | 48.4% | 49.1% | 49.5% |
Highest level of educational attainment in Chattanooga for adults over 25
See the full breakdown
4.0% of adults in Chattanooga completed < 9th grade.
6.0% of adults in Chattanooga completed 9-12th grade.
25.0% of adults in Chattanooga completed high school / ged.
21.0% of adults in Chattanooga completed some college.
8.0% of adults in Chattanooga completed associate's degree.
22.0% of adults in Chattanooga completed bachelor's degree.
10.0% of adults in Chattanooga completed master's degree.
2.0% of adults in Chattanooga completed professional degree.
2.0% of adults in Chattanooga completed doctorate degree.
| Education | Chattanooga | TN | USA |
|---|---|---|---|
| < 9th Grade | 4.0% | 4.0% | 4.0% |
| 9-12th Grade | 6.0% | 6.0% | 6.0% |
| High School / GED | 25.0% | 31.0% | 26.0% |
| Some College | 21.0% | 20.0% | 19.0% |
| Associate's Degree | 8.0% | 8.0% | 9.0% |
| Bachelor's Degree | 22.0% | 19.0% | 22.0% |
| Master's Degree | 10.0% | 8.0% | 10.0% |
| Professional Degree | 2.0% | 2.0% | 2.0% |
| Doctorate Degree | 2.0% | 2.0% | 2.0% |
Household Income For Chattanooga, Tennessee
See the full breakdown
6.2% of households in Chattanooga earn Less than $10,000.
5.5% of households in Chattanooga earn $10,000 to $14,999.
7.0% of households in Chattanooga earn $15,000 to $24,999.
7.2% of households in Chattanooga earn $25,000 to $34,999.
13.5% of households in Chattanooga earn $35,000 to $49,999.
17.2% of households in Chattanooga earn $50,000 to $74,999.
11.4% of households in Chattanooga earn $75,000 to $99,999.
15.8% of households in Chattanooga earn $100,000 to $149,999.
6.7% of households in Chattanooga earn $150,000 to $199,999.
9.3% of households in Chattanooga earn $200,000 or more.
| Income | Chattanooga | TN | USA |
|---|---|---|---|
| Less than $10,000 | 6.2% | 5.2% | 5.0% |
| $10,000 to $14,999 | 5.5% | 4.0% | 3.4% |
| $15,000 to $24,999 | 7.0% | 7.4% | 6.3% |
| $25,000 to $34,999 | 7.2% | 7.4% | 6.6% |
| $35,000 to $49,999 | 13.5% | 12.0% | 10.1% |
| $50,000 to $74,999 | 17.2% | 17.3% | 15.5% |
| $75,000 to $99,999 | 11.4% | 13.2% | 12.6% |
| $100,000 to $149,999 | 15.8% | 16.8% | 17.5% |
| $150,000 to $199,999 | 6.7% | 7.7% | 9.6% |
| $200,000 or more | 9.3% | 9.0% | 13.4% |
Source: U.S. Census ACS 5-year estimates (2024)


