Farragut SnackAbility
Overall SnackAbility
Cost of living in Farragut summary. We use data on the cost of living to determine how expensive it is to live in Farragut. Real estate prices drive most of the variance in cost of living around Tennessee. Key points include:
The cost of living in Farragut is 123 with 100 being average.
The cost of living in Farragut is 1.2x higher than the national average.
The median home value in Farragut is $688,600.
The median income in Farragut is $142,093.
Farragut's Overall Cost Of Living
Higher Than The National Average
Cost Of Living In Farragut Comparison Table
| Living Expense | Farragut | Tennessee | National Average |
|---|---|---|---|
| Overall | 123 | 94 | 100 |
| Services | 94 | 99 | 100 |
| Groceries | 100 | 96 | 100 |
| Health | 184 | 82 | 100 |
| Housing | 96 | 95 | 100 |
| Transportation | 96 | 99 | 100 |
| Utilities | 94 | 98 | 100 |
Source: Cost of living index, normalized to US average = 100
Farragut, TN Weather
The average high in Farragut is 68.5° and the average low is 47.2°.
There are 87.6 days of precipitation each year.
Expect an average of 48.9 inches of precipitation each year with 6.2 inches of snow.
| Stat | Farragut |
|---|---|
| Average Annual High | 68.5 |
| Average Annual Low | 47.2 |
| Annual Precipitation Days | 87.6 |
| Average Annual Precipitation | 48.9 |
| Average Annual Snowfall | 6.2 |
Average High
Days of Rain
Source: NOAA climate normals (30-year)
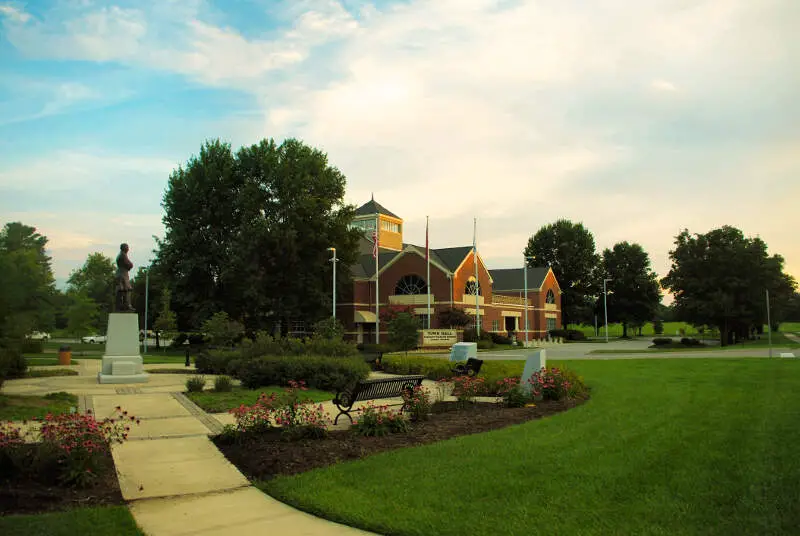
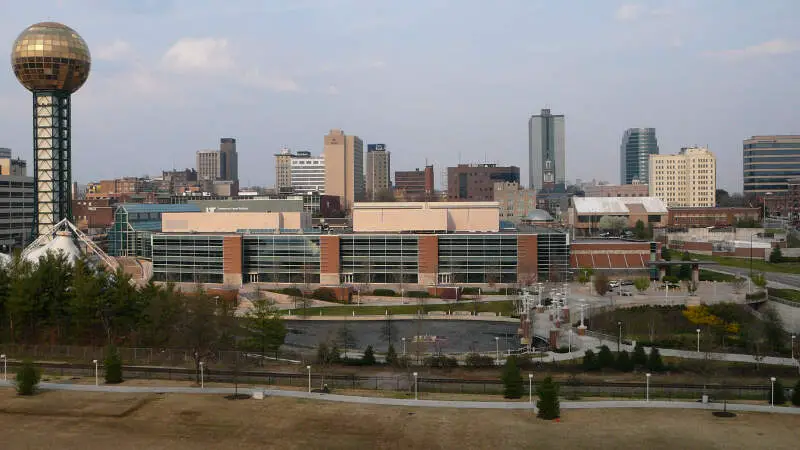
Farragut, TN Photos


Rankings & Articles For Farragut


Locations Around Farragut
Map Of Farragut, TN
Best Places Around Farragut
Kingston, TN
Population 6,224
Oak Ridge, TN
Population 32,693
Clinton, TN
Population 10,239
Alcoa, TN
Population 12,222
Knoxville, TN
Population 195,185
Maryville, TN
Population 32,392
Farragut Demographics And Statistics
Population over time in Farragut
The current population in Farragut is 24,634. The population has increased 22.2% from 2010.
| Year | Population | % Change |
|---|---|---|
| 2024 | 24,634 | 1.3% |
| 2023 | 24,309 | 2.2% |
| 2022 | 23,795 | 1.7% |
| 2021 | 23,388 | 1.2% |
| 2020 | 23,110 | 2.1% |
| 2019 | 22,631 | 1.7% |
| 2018 | 22,260 | 1.3% |
| 2017 | 21,975 | 1.3% |
| 2016 | 21,690 | 1.5% |
| 2015 | 21,374 | 1.2% |
| 2014 | 21,111 | 0.9% |
| 2013 | 20,913 | 1.1% |
| 2012 | 20,688 | 1.2% |
| 2011 | 20,448 | 1.5% |
| 2010 | 20,154 | - |
Race / Ethnicity in Farragut
See the full breakdown
Farragut is:
88.7% White with 21,849 White residents.
1.0% African American with 250 African American residents.
0.0% American Indian with 11 American Indian residents.
4.5% Asian with 1,115 Asian residents.
0.4% Hawaiian with 89 Hawaiian residents.
0.1% Other with 19 Other residents.
2.9% Two Or More with 719 Two Or More residents.
2.4% Hispanic with 582 Hispanic residents.
| Race | Farragut | TN | USA |
|---|---|---|---|
| White | 88.7% | 71.0% | 57.4% |
| African American | 1.0% | 15.4% | 11.9% |
| American Indian | 0.0% | 0.1% | 0.5% |
| Asian | 4.5% | 1.9% | 5.9% |
| Hawaiian | 0.4% | 0.1% | 0.2% |
| Other | 0.1% | 0.4% | 0.6% |
| Two Or More | 2.9% | 3.7% | 4.3% |
| Hispanic | 2.4% | 7.4% | 19.3% |
Gender in Farragut
See the full breakdown
Farragut is 51.2% female with 12,603 female residents.
Farragut is 48.8% male with 12,031 male residents.
| Gender | Farragut | TN | USA |
|---|---|---|---|
| Female | 51.2% | 50.9% | 50.5% |
| Male | 48.8% | 49.1% | 49.5% |
Highest level of educational attainment in Farragut for adults over 25
See the full breakdown
1.0% of adults in Farragut completed < 9th grade.
1.0% of adults in Farragut completed 9-12th grade.
11.0% of adults in Farragut completed high school / ged.
13.0% of adults in Farragut completed some college.
9.0% of adults in Farragut completed associate's degree.
36.0% of adults in Farragut completed bachelor's degree.
19.0% of adults in Farragut completed master's degree.
5.0% of adults in Farragut completed professional degree.
5.0% of adults in Farragut completed doctorate degree.
| Education | Farragut | TN | USA |
|---|---|---|---|
| < 9th Grade | 1.0% | 4.0% | 4.0% |
| 9-12th Grade | 1.0% | 6.0% | 6.0% |
| High School / GED | 11.0% | 31.0% | 26.0% |
| Some College | 13.0% | 20.0% | 19.0% |
| Associate's Degree | 9.0% | 8.0% | 9.0% |
| Bachelor's Degree | 36.0% | 19.0% | 22.0% |
| Master's Degree | 19.0% | 8.0% | 10.0% |
| Professional Degree | 5.0% | 2.0% | 2.0% |
| Doctorate Degree | 5.0% | 2.0% | 2.0% |
Household Income For Farragut, Tennessee
See the full breakdown
2.2% of households in Farragut earn Less than $10,000.
1.4% of households in Farragut earn $10,000 to $14,999.
1.2% of households in Farragut earn $15,000 to $24,999.
3.5% of households in Farragut earn $25,000 to $34,999.
5.6% of households in Farragut earn $35,000 to $49,999.
8.8% of households in Farragut earn $50,000 to $74,999.
11.0% of households in Farragut earn $75,000 to $99,999.
21.1% of households in Farragut earn $100,000 to $149,999.
13.4% of households in Farragut earn $150,000 to $199,999.
31.8% of households in Farragut earn $200,000 or more.
| Income | Farragut | TN | USA |
|---|---|---|---|
| Less than $10,000 | 2.2% | 5.2% | 5.0% |
| $10,000 to $14,999 | 1.4% | 4.0% | 3.4% |
| $15,000 to $24,999 | 1.2% | 7.4% | 6.3% |
| $25,000 to $34,999 | 3.5% | 7.4% | 6.6% |
| $35,000 to $49,999 | 5.6% | 12.0% | 10.1% |
| $50,000 to $74,999 | 8.8% | 17.3% | 15.5% |
| $75,000 to $99,999 | 11.0% | 13.2% | 12.6% |
| $100,000 to $149,999 | 21.1% | 16.8% | 17.5% |
| $150,000 to $199,999 | 13.4% | 7.7% | 9.6% |
| $200,000 or more | 31.8% | 9.0% | 13.4% |
Source: U.S. Census ACS 5-year estimates (2024)


