Greeneville SnackAbility
Overall SnackAbility
Crime in Greeneville summary. We use data from the FBI to determine the crime rates in Greeneville. Key points include:
There were 342 total crimes in Greeneville in the last reporting year.
The overall crime rate per 100,000 people in Greeneville is 2,155.6 / 100k people.
The violent crime rate per 100,000 people in Greeneville is 258.4 / 100k people.
The property crime rate per 100,000 people in Greeneville is 1,897.1 / 100k people.
Overall, crime in Greeneville is 1.71% above the national average.
Total Crimes
Above National Average
Crime In Greeneville Comparison Table
| Statistic | Count Raw |
Greeneville / 100k People |
Tennessee / 100k People |
National / 100k People |
|---|---|---|---|---|
| Total Crimes Per 100K | 342 | 2,155.6 | 2,624.4 | 2,119.2 |
| Violent Crime | 41 | 258.4 | 592.3 | 359.0 |
| Murder | 0 | 0.0 | 7.9 | 5.0 |
| Robbery | 0 | 0.0 | 58.4 | 61.0 |
| Aggravated Assault | 38 | 239.5 | 488.6 | 256.0 |
| Property Crime | 301 | 1,897.1 | 2,032.1 | 1,760.0 |
| Burglary | 47 | 296.2 | 251.8 | 229.0 |
| Larceny | 226 | 1,424.4 | 1,443.6 | 1,272.0 |
| Car Theft | 28 | 176.5 | 336.7 | 259.0 |
Source: FBI Uniform Crime Reporting (2024)
Cost of living in Greeneville summary. We use data on the cost of living to determine how expensive it is to live in Greeneville. Real estate prices drive most of the variance in cost of living around Tennessee. Key points include:
The cost of living in Greeneville is 92 with 100 being average.
The cost of living in Greeneville is 0.9x lower than the national average.
The median home value in Greeneville is $248,040.
The median income in Greeneville is $49,889.
Greeneville's Overall Cost Of Living
Lower Than The National Average
Cost Of Living In Greeneville Comparison Table
| Living Expense | Greeneville | Tennessee | National Average |
|---|---|---|---|
| Overall | 92 | 94 | 100 |
| Services | 97 | 99 | 100 |
| Groceries | 98 | 96 | 100 |
| Health | 78 | 82 | 100 |
| Housing | 98 | 95 | 100 |
| Transportation | 98 | 99 | 100 |
| Utilities | 94 | 98 | 100 |
Source: Cost of living index, normalized to US average = 100
Greeneville, TN Weather
The average high in Greeneville is 68.6° and the average low is 44.7°.
There are 86.0 days of precipitation each year.
Expect an average of 43.1 inches of precipitation each year with 8.9 inches of snow.
| Stat | Greeneville |
|---|---|
| Average Annual High | 68.6 |
| Average Annual Low | 44.7 |
| Annual Precipitation Days | 86.0 |
| Average Annual Precipitation | 43.1 |
| Average Annual Snowfall | 8.9 |
Average High
Days of Rain
Source: NOAA climate normals (30-year)
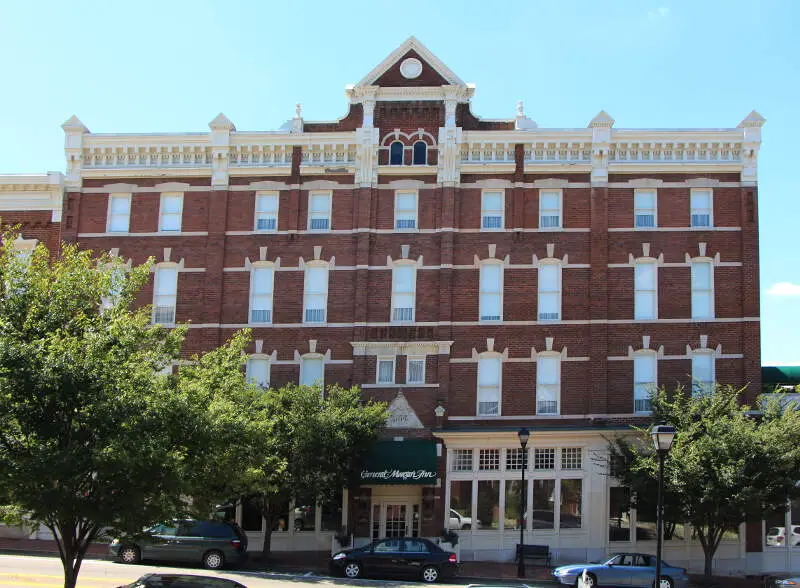
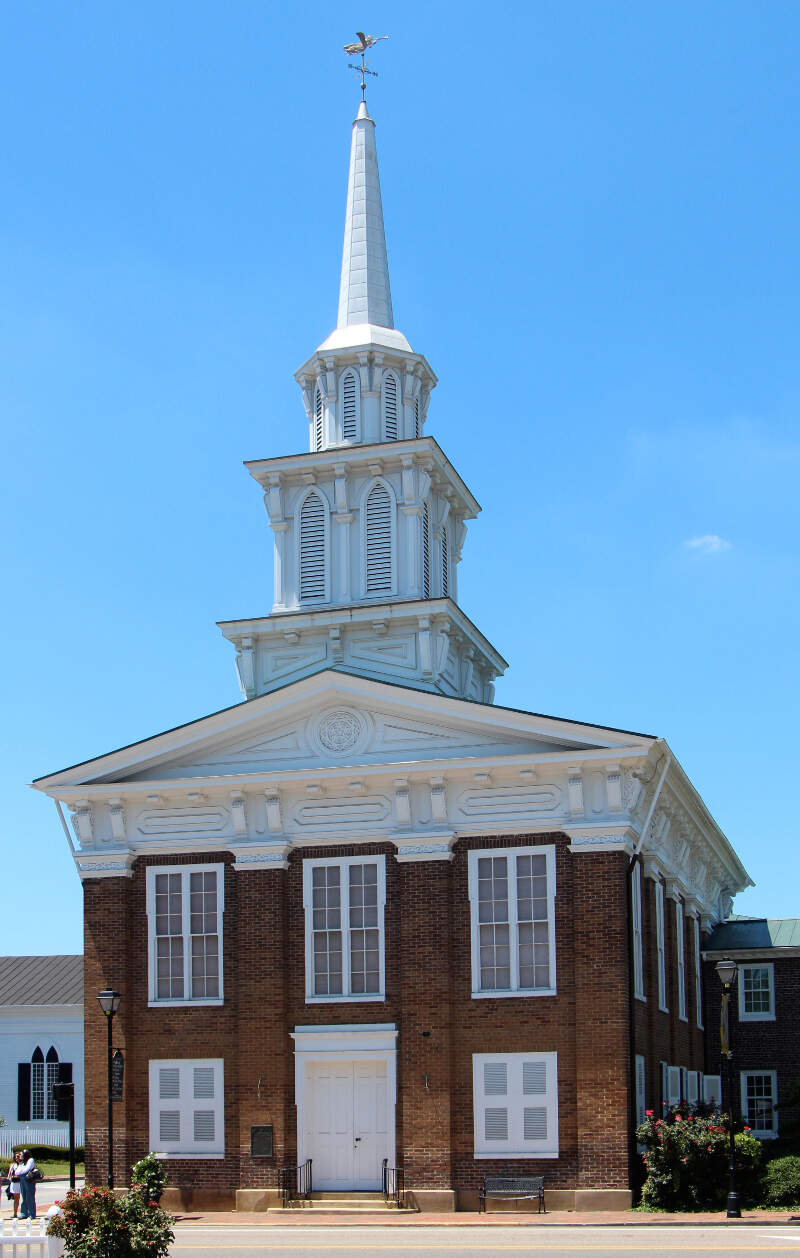
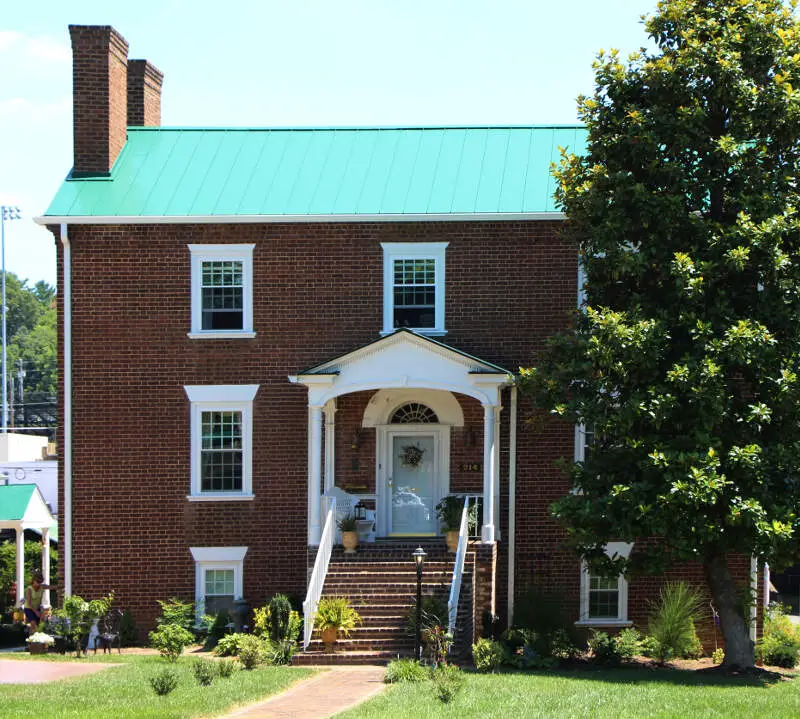
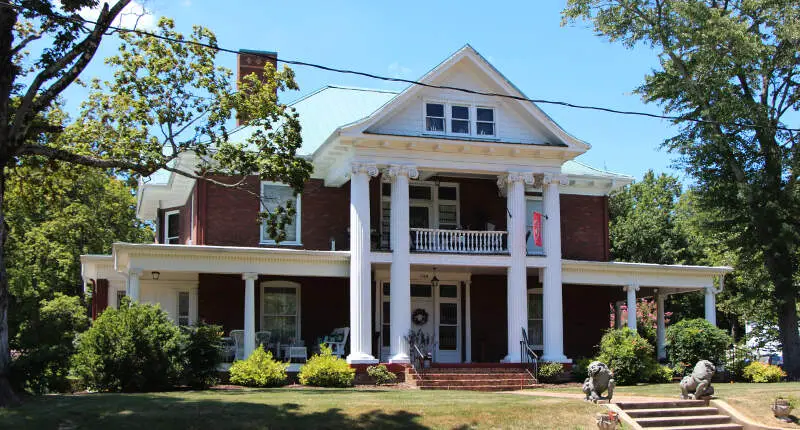
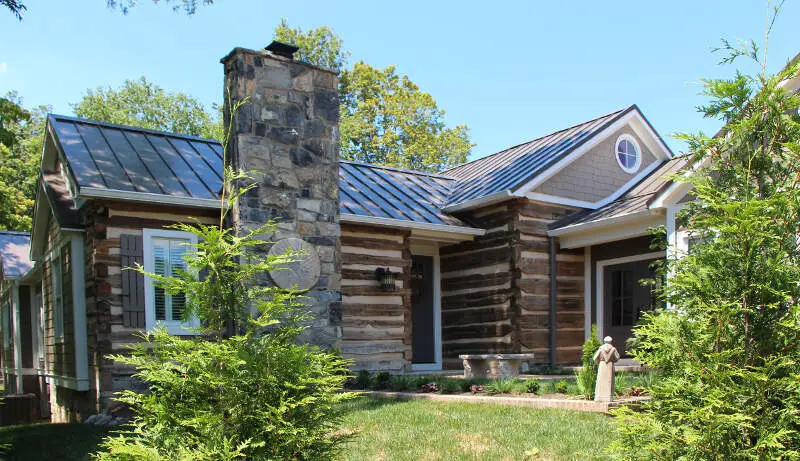
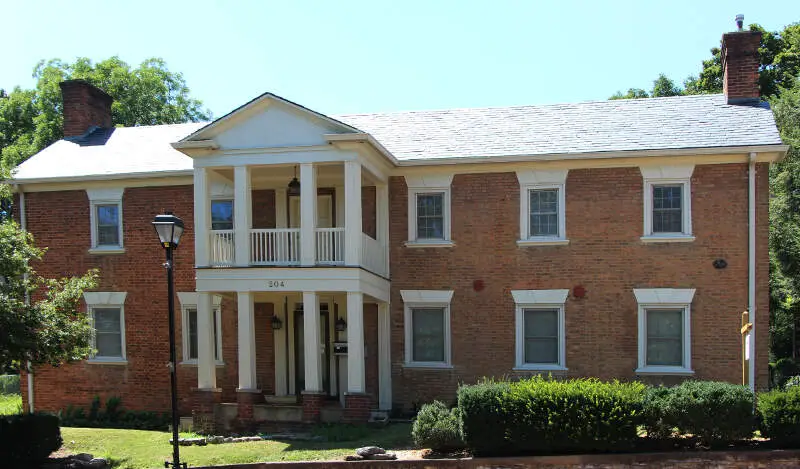
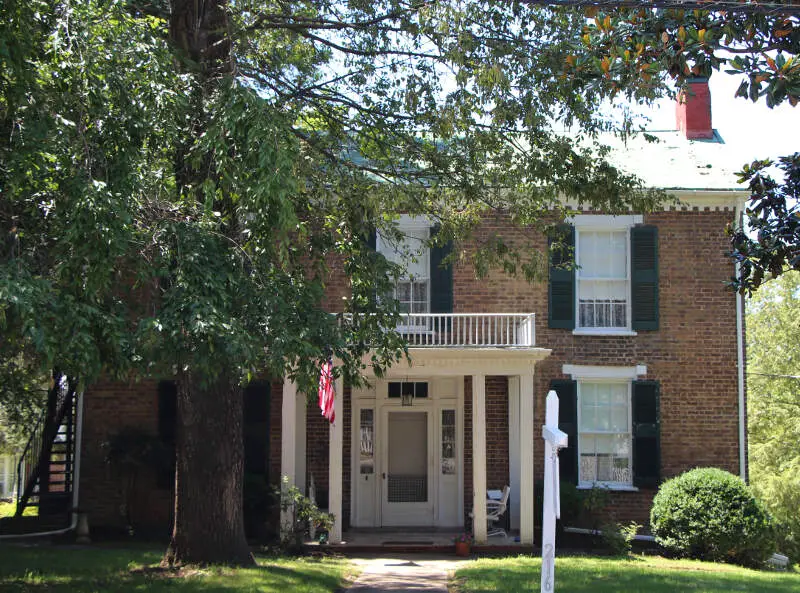
Greeneville, TN Photos


Rankings & Articles For Greeneville


Locations Around Greeneville
Map Of Greeneville, TN
Best Places Around Greeneville
Asheville, NC
Population 94,535
Black Mountain, NC
Population 8,513
Woodfin, NC
Population 8,048
Mount Carmel, TN
Population 5,472
Morristown, TN
Population 31,527
Waynesville, NC
Population 10,502
Jonesborough, TN
Population 6,232
Sevierville, TN
Population 18,397
Church Hill, TN
Population 7,139
Bloomingdale, TN
Population 9,292
Greeneville Demographics And Statistics
Population over time in Greeneville
The current population in Greeneville is 15,646. The population has increased 3.0% from 2010.
| Year | Population | % Change |
|---|---|---|
| 2024 | 15,646 | 0.7% |
| 2023 | 15,531 | 0.5% |
| 2022 | 15,458 | 0.6% |
| 2021 | 15,361 | 2.8% |
| 2020 | 14,938 | -0.0% |
| 2019 | 14,942 | 0.3% |
| 2018 | 14,896 | 0.0% |
| 2017 | 14,895 | -0.9% |
| 2016 | 15,035 | 0.0% |
| 2015 | 15,031 | 0.1% |
| 2014 | 15,015 | -0.4% |
| 2013 | 15,075 | -0.2% |
| 2012 | 15,106 | -0.4% |
| 2011 | 15,166 | -0.2% |
| 2010 | 15,189 | - |
Race / Ethnicity in Greeneville
See the full breakdown
Greeneville is:
85.1% White with 13,311 White residents.
2.4% African American with 383 African American residents.
0.1% American Indian with 11 American Indian residents.
0.4% Asian with 68 Asian residents.
0.0% Hawaiian with 0 Hawaiian residents.
0.0% Other with 0 Other residents.
6.4% Two Or More with 996 Two Or More residents.
5.6% Hispanic with 877 Hispanic residents.
| Race | Greeneville | TN | USA |
|---|---|---|---|
| White | 85.1% | 71.0% | 57.4% |
| African American | 2.4% | 15.4% | 11.9% |
| American Indian | 0.1% | 0.1% | 0.5% |
| Asian | 0.4% | 1.9% | 5.9% |
| Hawaiian | 0.0% | 0.1% | 0.2% |
| Other | 0.0% | 0.4% | 0.6% |
| Two Or More | 6.4% | 3.7% | 4.3% |
| Hispanic | 5.6% | 7.4% | 19.3% |
Gender in Greeneville
See the full breakdown
Greeneville is 52.0% female with 8,142 female residents.
Greeneville is 48.0% male with 7,503 male residents.
| Gender | Greeneville | TN | USA |
|---|---|---|---|
| Female | 52.0% | 50.9% | 50.5% |
| Male | 48.0% | 49.1% | 49.5% |
Highest level of educational attainment in Greeneville for adults over 25
See the full breakdown
4.0% of adults in Greeneville completed < 9th grade.
6.0% of adults in Greeneville completed 9-12th grade.
36.0% of adults in Greeneville completed high school / ged.
20.0% of adults in Greeneville completed some college.
7.0% of adults in Greeneville completed associate's degree.
16.0% of adults in Greeneville completed bachelor's degree.
9.0% of adults in Greeneville completed master's degree.
1.0% of adults in Greeneville completed professional degree.
1.0% of adults in Greeneville completed doctorate degree.
| Education | Greeneville | TN | USA |
|---|---|---|---|
| < 9th Grade | 4.0% | 4.0% | 4.0% |
| 9-12th Grade | 6.0% | 6.0% | 6.0% |
| High School / GED | 36.0% | 31.0% | 26.0% |
| Some College | 20.0% | 20.0% | 19.0% |
| Associate's Degree | 7.0% | 8.0% | 9.0% |
| Bachelor's Degree | 16.0% | 19.0% | 22.0% |
| Master's Degree | 9.0% | 8.0% | 10.0% |
| Professional Degree | 1.0% | 2.0% | 2.0% |
| Doctorate Degree | 1.0% | 2.0% | 2.0% |
Household Income For Greeneville, Tennessee
See the full breakdown
5.9% of households in Greeneville earn Less than $10,000.
11.5% of households in Greeneville earn $10,000 to $14,999.
10.6% of households in Greeneville earn $15,000 to $24,999.
11.9% of households in Greeneville earn $25,000 to $34,999.
10.4% of households in Greeneville earn $35,000 to $49,999.
16.9% of households in Greeneville earn $50,000 to $74,999.
11.2% of households in Greeneville earn $75,000 to $99,999.
11.1% of households in Greeneville earn $100,000 to $149,999.
5.3% of households in Greeneville earn $150,000 to $199,999.
5.3% of households in Greeneville earn $200,000 or more.
| Income | Greeneville | TN | USA |
|---|---|---|---|
| Less than $10,000 | 5.9% | 5.2% | 5.0% |
| $10,000 to $14,999 | 11.5% | 4.0% | 3.4% |
| $15,000 to $24,999 | 10.6% | 7.4% | 6.3% |
| $25,000 to $34,999 | 11.9% | 7.4% | 6.6% |
| $35,000 to $49,999 | 10.4% | 12.0% | 10.1% |
| $50,000 to $74,999 | 16.9% | 17.3% | 15.5% |
| $75,000 to $99,999 | 11.2% | 13.2% | 12.6% |
| $100,000 to $149,999 | 11.1% | 16.8% | 17.5% |
| $150,000 to $199,999 | 5.3% | 7.7% | 9.6% |
| $200,000 or more | 5.3% | 9.0% | 13.4% |
Source: U.S. Census ACS 5-year estimates (2024)


