Mcminnville SnackAbility
Overall SnackAbility
Crime in McMinnville summary. We use data from the FBI to determine the crime rates in McMinnville. Key points include:
There were 318 total crimes in McMinnville in the last reporting year.
The overall crime rate per 100,000 people in McMinnville is 2,306.5 / 100k people.
The violent crime rate per 100,000 people in McMinnville is 638.3 / 100k people.
The property crime rate per 100,000 people in McMinnville is 1,668.2 / 100k people.
Overall, crime in McMinnville is 8.84% above the national average.
Total Crimes
Above National Average
Crime In McMinnville Comparison Table
| Statistic | Count Raw |
McMinnville / 100k People |
Tennessee / 100k People |
National / 100k People |
|---|---|---|---|---|
| Total Crimes Per 100K | 318 | 2,306.5 | 2,624.4 | 2,119.2 |
| Violent Crime | 88 | 638.3 | 592.3 | 359.0 |
| Murder | 0 | 0.0 | 7.9 | 5.0 |
| Robbery | 1 | 7.3 | 58.4 | 61.0 |
| Aggravated Assault | 76 | 551.2 | 488.6 | 256.0 |
| Property Crime | 230 | 1,668.2 | 2,032.1 | 1,760.0 |
| Burglary | 28 | 203.1 | 251.8 | 229.0 |
| Larceny | 189 | 1,370.9 | 1,443.6 | 1,272.0 |
| Car Theft | 13 | 94.3 | 336.7 | 259.0 |
Source: FBI Uniform Crime Reporting (2024)
Cost of living in McMinnville summary. We use data on the cost of living to determine how expensive it is to live in McMinnville. Real estate prices drive most of the variance in cost of living around Tennessee. Key points include:
The cost of living in McMinnville is 85 with 100 being average.
The cost of living in McMinnville is 0.8x lower than the national average.
The median home value in McMinnville is $255,402.
The median income in McMinnville is $47,179.
Mcminnville's Overall Cost Of Living
Lower Than The National Average
Cost Of Living In McMinnville Comparison Table
| Living Expense | McMinnville | Tennessee | National Average |
|---|---|---|---|
| Overall | 85 | 94 | 100 |
| Services | 98 | 99 | 100 |
| Groceries | 96 | 96 | 100 |
| Health | 60 | 82 | 100 |
| Housing | 94 | 95 | 100 |
| Transportation | 98 | 99 | 100 |
| Utilities | 95 | 98 | 100 |
Source: Cost of living index, normalized to US average = 100
Mcminnville, TN Weather
The average high in McMinnville is 69.5° and the average low is 46.9°.
There are 77.6 days of precipitation each year.
Expect an average of 52.6 inches of precipitation each year with 5.0 inches of snow.
| Stat | McMinnville |
|---|---|
| Average Annual High | 69.5 |
| Average Annual Low | 46.9 |
| Annual Precipitation Days | 77.6 |
| Average Annual Precipitation | 52.6 |
| Average Annual Snowfall | 5.0 |
Average High
Days of Rain
Source: NOAA climate normals (30-year)
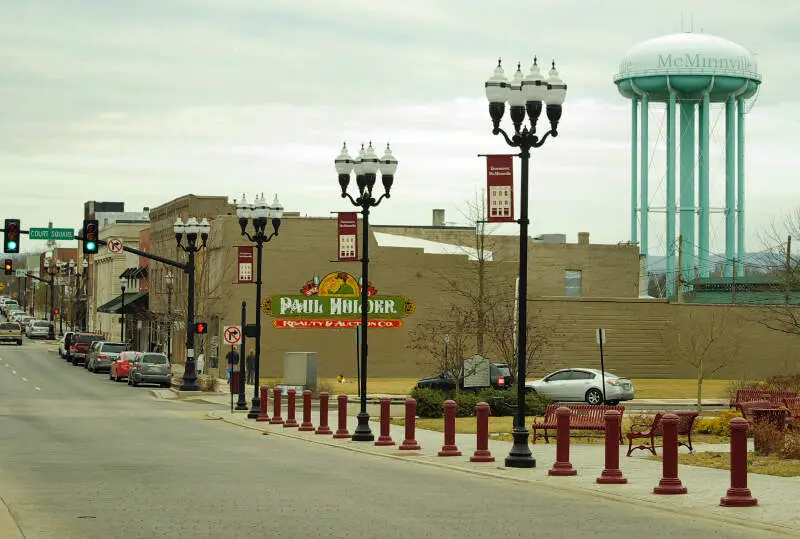
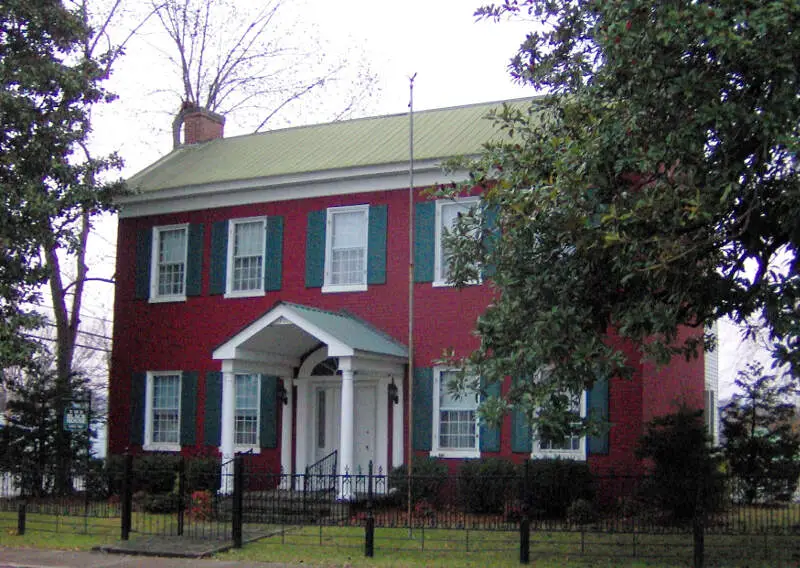
Mcminnville, TN Photos
Rankings & Articles For McMinnville


Locations Around McMinnville
Map Of McMinnville, TN
Best Places Around McMinnville
Signal Mountain, TN
Population 8,860
Middle Valley, TN
Population 12,187
Smyrna, TN
Population 56,692
Lebanon, TN
Population 44,788
Murfreesboro, TN
Population 161,445
La Vergne, TN
Population 40,243
Soddy-Daisy, TN
Population 13,231
Tullahoma, TN
Population 21,103
Red Bank, TN
Population 12,010
Manchester, TN
Population 12,944
McMinnville Demographics And Statistics
Population over time in McMinnville
The current population in McMinnville is 13,844. The population has increased 2.8% from 2010.
| Year | Population | % Change |
|---|---|---|
| 2024 | 13,844 | 0.6% |
| 2023 | 13,765 | 0.1% |
| 2022 | 13,756 | 0.4% |
| 2021 | 13,699 | -0.1% |
| 2020 | 13,707 | 0.1% |
| 2019 | 13,695 | 0.3% |
| 2018 | 13,650 | 0.4% |
| 2017 | 13,591 | -0.5% |
| 2016 | 13,664 | 0.1% |
| 2015 | 13,651 | 0.4% |
| 2014 | 13,600 | -0.1% |
| 2013 | 13,609 | 0.3% |
| 2012 | 13,567 | 0.3% |
| 2011 | 13,528 | 0.4% |
| 2010 | 13,473 | - |
Race / Ethnicity in McMinnville
See the full breakdown
McMinnville is:
77.3% White with 10,695 White residents.
4.2% African American with 588 African American residents.
0.1% American Indian with 7 American Indian residents.
1.0% Asian with 143 Asian residents.
0.0% Hawaiian with 0 Hawaiian residents.
0.0% Other with 2 Other residents.
3.5% Two Or More with 485 Two Or More residents.
13.9% Hispanic with 1,924 Hispanic residents.
| Race | McMinnville | TN | USA |
|---|---|---|---|
| White | 77.3% | 71.0% | 57.4% |
| African American | 4.2% | 15.4% | 11.9% |
| American Indian | 0.1% | 0.1% | 0.5% |
| Asian | 1.0% | 1.9% | 5.9% |
| Hawaiian | 0.0% | 0.1% | 0.2% |
| Other | 0.0% | 0.4% | 0.6% |
| Two Or More | 3.5% | 3.7% | 4.3% |
| Hispanic | 13.9% | 7.4% | 19.3% |
Gender in McMinnville
See the full breakdown
McMinnville is 51.8% female with 7,168 female residents.
McMinnville is 48.2% male with 6,675 male residents.
| Gender | McMinnville | TN | USA |
|---|---|---|---|
| Female | 51.8% | 50.9% | 50.5% |
| Male | 48.2% | 49.1% | 49.5% |
Highest level of educational attainment in McMinnville for adults over 25
See the full breakdown
5.0% of adults in McMinnville completed < 9th grade.
10.0% of adults in McMinnville completed 9-12th grade.
52.0% of adults in McMinnville completed high school / ged.
16.0% of adults in McMinnville completed some college.
5.0% of adults in McMinnville completed associate's degree.
8.0% of adults in McMinnville completed bachelor's degree.
3.0% of adults in McMinnville completed master's degree.
0.0% of adults in McMinnville completed professional degree.
1.0% of adults in McMinnville completed doctorate degree.
| Education | McMinnville | TN | USA |
|---|---|---|---|
| < 9th Grade | 5.0% | 4.0% | 4.0% |
| 9-12th Grade | 10.0% | 6.0% | 6.0% |
| High School / GED | 52.0% | 31.0% | 26.0% |
| Some College | 16.0% | 20.0% | 19.0% |
| Associate's Degree | 5.0% | 8.0% | 9.0% |
| Bachelor's Degree | 8.0% | 19.0% | 22.0% |
| Master's Degree | 3.0% | 8.0% | 10.0% |
| Professional Degree | 0.0% | 2.0% | 2.0% |
| Doctorate Degree | 1.0% | 2.0% | 2.0% |
Household Income For McMinnville, Tennessee
See the full breakdown
6.3% of households in McMinnville earn Less than $10,000.
8.6% of households in McMinnville earn $10,000 to $14,999.
12.5% of households in McMinnville earn $15,000 to $24,999.
13.2% of households in McMinnville earn $25,000 to $34,999.
10.8% of households in McMinnville earn $35,000 to $49,999.
25.0% of households in McMinnville earn $50,000 to $74,999.
9.4% of households in McMinnville earn $75,000 to $99,999.
9.0% of households in McMinnville earn $100,000 to $149,999.
2.9% of households in McMinnville earn $150,000 to $199,999.
2.3% of households in McMinnville earn $200,000 or more.
| Income | McMinnville | TN | USA |
|---|---|---|---|
| Less than $10,000 | 6.3% | 5.2% | 5.0% |
| $10,000 to $14,999 | 8.6% | 4.0% | 3.4% |
| $15,000 to $24,999 | 12.5% | 7.4% | 6.3% |
| $25,000 to $34,999 | 13.2% | 7.4% | 6.6% |
| $35,000 to $49,999 | 10.8% | 12.0% | 10.1% |
| $50,000 to $74,999 | 25.0% | 17.3% | 15.5% |
| $75,000 to $99,999 | 9.4% | 13.2% | 12.6% |
| $100,000 to $149,999 | 9.0% | 16.8% | 17.5% |
| $150,000 to $199,999 | 2.9% | 7.7% | 9.6% |
| $200,000 or more | 2.3% | 9.0% | 13.4% |
Source: U.S. Census ACS 5-year estimates (2024)


