Compare Memphis to…
Memphis SnackAbility
Overall SnackAbility
Crime in Memphis summary. We use data from the FBI to determine the crime rates in Memphis. Key points include:
There were 57,643 total crimes in Memphis in the last reporting year.
The overall crime rate per 100,000 people in Memphis is 9,400.3 / 100k people.
The violent crime rate per 100,000 people in Memphis is 2,501.3 / 100k people.
The property crime rate per 100,000 people in Memphis is 6,899.0 / 100k people.
Overall, crime in Memphis is 343.57% above the national average.
Total Crimes
Above National Average
Crime In Memphis Comparison Table
| Statistic | Count Raw |
Memphis / 100k People |
Tennessee / 100k People |
National / 100k People |
|---|---|---|---|---|
| Total Crimes Per 100K | 57,643 | 9,400.3 | 2,624.4 | 2,119.2 |
| Violent Crime | 15,338 | 2,501.3 | 592.3 | 359.0 |
| Murder | 249 | 40.6 | 7.9 | 5.0 |
| Robbery | 2,138 | 348.7 | 58.4 | 61.0 |
| Aggravated Assault | 12,522 | 2,042.1 | 488.6 | 256.0 |
| Property Crime | 42,305 | 6,899.0 | 2,032.1 | 1,760.0 |
| Burglary | 5,616 | 915.8 | 251.8 | 229.0 |
| Larceny | 26,978 | 4,399.5 | 1,443.6 | 1,272.0 |
| Car Theft | 9,711 | 1,583.6 | 336.7 | 259.0 |
Source: FBI Uniform Crime Reporting (2024)
Cost of living in Memphis summary. We use data on the cost of living to determine how expensive it is to live in Memphis. Real estate prices drive most of the variance in cost of living around Tennessee. Key points include:
The cost of living in Memphis is 93 with 100 being average.
The cost of living in Memphis is 0.9x lower than the national average.
The median home value in Memphis is $144,710.
The median income in Memphis is $51,736.
Memphis's Overall Cost Of Living
Lower Than The National Average
Cost Of Living In Memphis Comparison Table
| Living Expense | Memphis | Tennessee | National Average |
|---|---|---|---|
| Overall | 93 | 94 | 100 |
| Services | 102 | 99 | 100 |
| Groceries | 94 | 96 | 100 |
| Health | 71 | 82 | 100 |
| Housing | 102 | 95 | 100 |
| Transportation | 99 | 99 | 100 |
| Utilities | 103 | 98 | 100 |
Source: Cost of living index, normalized to US average = 100
Memphis, TN Weather
The average high in Memphis is 71.4° and the average low is 51.5°.
There are 74.2 days of precipitation each year.
Expect an average of 53.2 inches of precipitation each year with 3.1 inches of snow.
| Stat | Memphis |
|---|---|
| Average Annual High | 71.4 |
| Average Annual Low | 51.5 |
| Annual Precipitation Days | 74.2 |
| Average Annual Precipitation | 53.2 |
| Average Annual Snowfall | 3.1 |
Average High
Days of Rain
Source: NOAA climate normals (30-year)
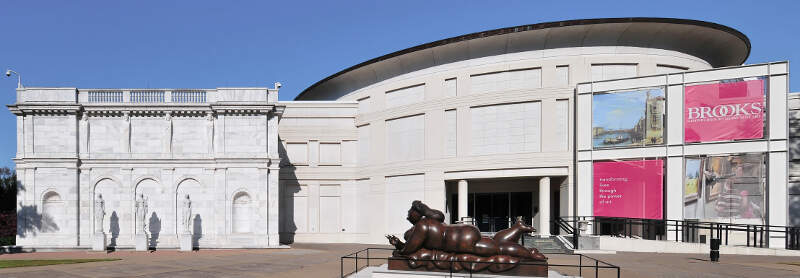
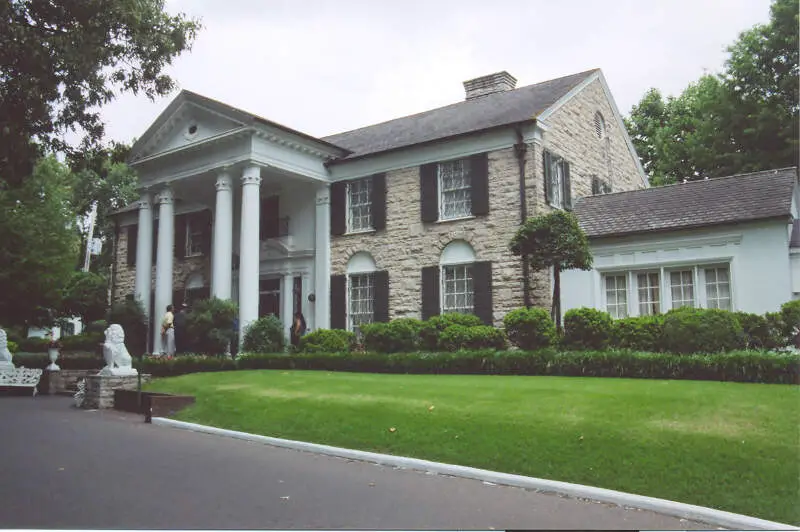
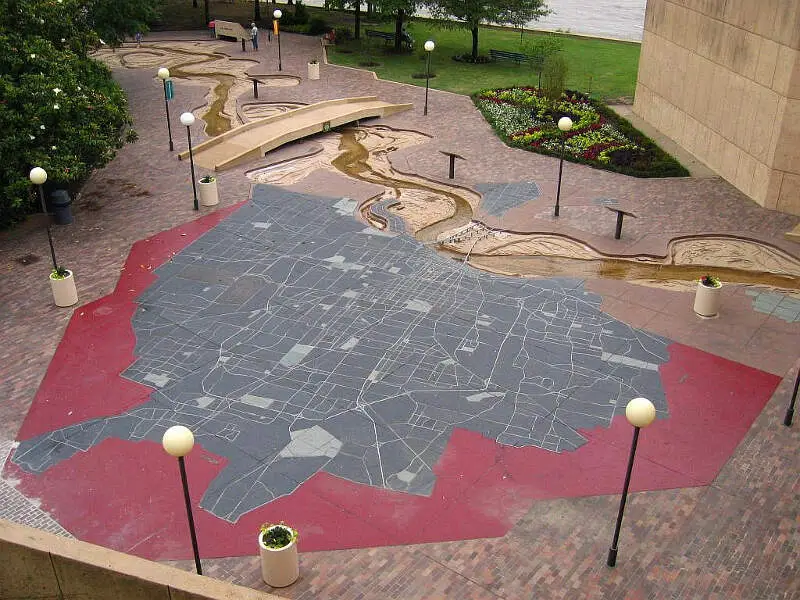
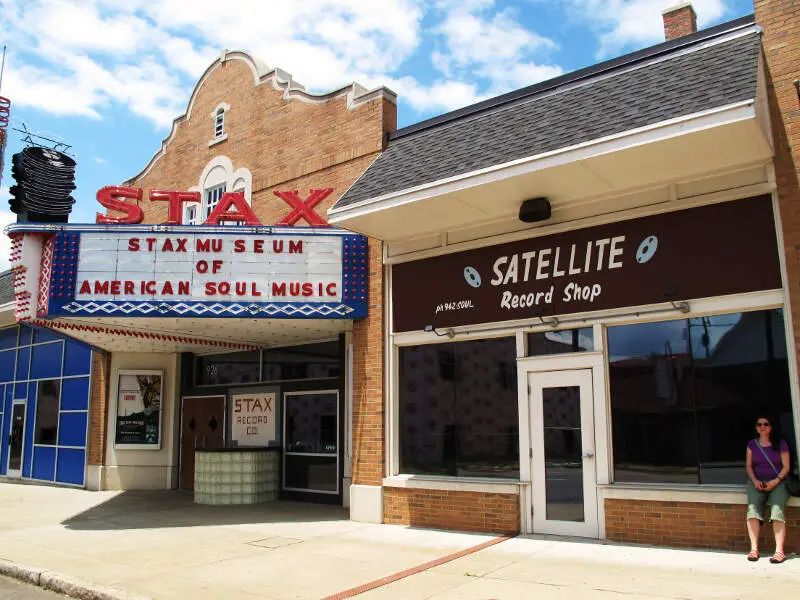
Memphis, TN Photos


20 Reviews & Comments About Memphis

I'm not from Memphis, however I've lived here the better part of my life. All of my children are originally from Memphis, which is probably what has kept me here way too long. I'll be honest by saying that I've never liked it here. In fact, I can't think of one thing that I like about Memphis...except the cost of living is much cheaper than other places I've lived, but still higher than other places I'd rather live. With that being said, this video and the stereotypes that it depicts are quite offensive to say the least. While I agree that this isn't a city I would recommend anyone move to, there are other things happening here besides crime, and there are far more working class citizens than common street thugs wandering around.
I live in Nashville there are no jobs in the country that's why ppl travel to other counties for work meanwhile in Memphis smh yeah its dangerous yeah ppl that live there should do better it is how you were raised and it's what you know that determines who you are. I'm not downing Memphis at all but yall can do better as ppl that live. Everywhere in this world there's a ghetto everywhere there's poverty everywhere there is government assistance it's not all blk ppl it's poor white ppl Mexicans all these foreign people from all over the world with d**n foodstamps so this s**t that's in this video is out dated but as far for the country parts that might be true it's still country ijs..
I live in Memphis, It's not that bad at all. Sure it has a hood slightly larger than other cities but every city has a hood. Everyone Stereotypes memphis as a #1 murder capital. If people have seen the progress in the last 10 years this would not be on there but everyone including this channel takes lists like this and changes up a few words. Has anyone ever heard of Chicago as the murder capital- No- G E T | Y O U R | F A C T S | R I G H T
I live in Tennessee and when I went to Memphis to see the big bass pros and all that I I turned my head every two seconds looking for a guy with a gun
woah you made memphis sound like the worst place on Earth. my dad was born and raised there and he has a family, a wonderful job and a half a million dollar house.
Dude, I live in Memphis. Crime is only really high in one place that no one goes to called Orange Mound. That's were you got the pictures of locked up tide, etc
I live in memphis and beem here my whole life. Not all of the people of memphis drink, smoke, and or have a gun
I live in Memphis and we're considered the worse city ever in TN... I'm somewhat proud we made it #1 somewhere
I live in memphis and I've never seen a single shooting happen near me. I must be in a calmer area
Lol I live in Memphis !,!,!, and I don't live bad at all
Bruh I live in Memphis, TN. And it's not that bad.
I live in Memphis TN- it doesn't seem that bad
Hey I'm glad to live in Memphis I was born here
The crime is very bad. Most people here don't have a life.
Beale Street is okay. Watch some of the people around here though.
Crime is high in this area. There some nice neighborhoods that are quiet and clean. For the most part this city is horrible.
What stood out the most are the people. They are rude and ignorant, talk on the phone while they serve you or gossip about customers in their face.
I like the convenience of living in the up town area of Memphis. its close to many restaurants and venues and the house I have is fairly new. the problem with Memphis is that no matter where you live, theres a slum area nearby. you can be driving through a neighborhood with upscale housing and clean streets and all of a sudden there's an area that definitely on the downgrade with abandoned houses, prostitutes, and trash laden streets.
wonderful music events and great food venues.
Very low cost of housing and no state income taxes are big advantages. Some surrounding communities have low crime and have good public schools, be careful of the local community and who you know. Not too unfriendly but fear new ideas, creativity and mistrust new people and anyone complaining about moving in to leave bad areas because of fear what would say about them. Somewhat luddite and expensive to fly in and out as Delta abandoned their hub in the small airport which is not international is keeping people out along with the reputation of the more dangerous localized areas and they're relatively mistrusting while liberal in and near the city in a conservative state. The issues are being worked on by the new Governor and big companies such as just opening a new facility in historic but areas in need.
Good is no state income tax and low cost of housing with low property taxes and some nice areas. Bad is high cost of flights, need to be careful about where to live and go.
Crime everywhere dirty streets and roads no jobs no money the people are the worst. The Christian whites are arrogant hypocrites and the regular whites are hateful drunks and druggies. Outside Dallas-Fort Worth Memphis has without a doubt the nastiness meanest people I've ever met. Lived there most of my life. Racism from blacks and whites add to the mix. Businesses close. Weather is hot as h**l in summer and cold as ice in winter. Rains all the time. It will rain for DAYS. About the only thing good is perhaps Topps Bar BBQ. I cannot reiterate the hatefulness and nastiness of the people that live in that city. I still think about it even though I moved away years ago. A vicious pack of vipers. But so many people in that city think Memphis is somehow good or great. Delusional.
Worst: The people. Wish I could say otherwise.
Better but still bad: weather.
Only good thing: low cost of living if you can call it that.
I've lived in Memphis since I was on highschool. Memphis is a city you love but hate. I love the people, I'm a white woman and I've lived downtown 7 block from Beal St. for 4yrs I live in midtown and I've lived in East Memphis the one thing they have in common is your only a couple of streets from a bad area so you have to be aware of your surroundings all the time.
The city has alot to like, Memphis in May, the Grizzlies, music fest.... but it has alot of negative.
My biggest complaint is city leaders they have screwed police and fire by cutting their benefits and pension. So now the city doesn't have enough fireman to operate the ambulance for most stations we do have private but response time is alot longer we have a severely depleted police department it's bad some stations don't have half the patrol cars out, by that I mean the 4pm to 1am shift should have 25ish patrol cars out but can fill 12 cars in South Memphis. At any given time there's 100-150 less police officers. This is all the mayor's fault he's been told the police have found ways to fix it but didn't want to because it might hurt reelection Chance's.. let that sink in. His reelection was more important than the lives of the citizens. Memphis has a lot of good but it has alot of bad most of which is in city hall. Thanks mayor Strickland
H20 will be the next statistic, he lives in a fantasy world. Nothing good about Memphis.
Staying off the streets, crime is a big big big problem.
Rankings & Articles For Memphis


Locations Around Memphis
Map Of Memphis, TN
Best Places Around Memphis
Germantown, TN
Population 40,673
Collierville, TN
Population 51,515
Bartlett, TN
Population 56,876
Horn Lake, MS
Population 26,647
Southaven, MS
Population 56,226
Olive Branch, MS
Population 47,019
Hernando, MS
Population 17,949
Millington, TN
Population 11,289
Marion, AR
Population 13,623
Lakeland, TN
Population 14,192
Memphis Demographics And Statistics
Population over time in Memphis
The current population in Memphis is 618,980. The population has decreased 5.5% from 2010.
| Year | Population | % Change |
|---|---|---|
| 2024 | 618,980 | -1.6% |
| 2023 | 629,063 | -0.2% |
| 2022 | 630,027 | -0.6% |
| 2021 | 634,139 | -2.6% |
| 2020 | 650,910 | -0.2% |
| 2019 | 651,932 | -0.2% |
| 2018 | 653,248 | -0.2% |
| 2017 | 654,723 | -0.2% |
| 2016 | 655,857 | -0.2% |
| 2015 | 657,167 | 0.1% |
| 2014 | 656,715 | 0.9% |
| 2013 | 650,932 | -0.0% |
| 2012 | 651,050 | -0.2% |
| 2011 | 652,123 | -0.4% |
| 2010 | 654,876 | - |
Race / Ethnicity in Memphis
See the full breakdown
Memphis is:
22.4% White with 138,561 White residents.
62.7% African American with 387,985 African American residents.
0.1% American Indian with 334 American Indian residents.
1.7% Asian with 10,442 Asian residents.
0.1% Hawaiian with 365 Hawaiian residents.
0.5% Other with 2,793 Other residents.
2.3% Two Or More with 13,994 Two Or More residents.
10.4% Hispanic with 64,506 Hispanic residents.
| Race | Memphis | TN | USA |
|---|---|---|---|
| White | 22.4% | 71.0% | 57.4% |
| African American | 62.7% | 15.4% | 11.9% |
| American Indian | 0.1% | 0.1% | 0.5% |
| Asian | 1.7% | 1.9% | 5.9% |
| Hawaiian | 0.1% | 0.1% | 0.2% |
| Other | 0.5% | 0.4% | 0.6% |
| Two Or More | 2.3% | 3.7% | 4.3% |
| Hispanic | 10.4% | 7.4% | 19.3% |
Gender in Memphis
See the full breakdown
Memphis is 52.6% female with 325,449 female residents.
Memphis is 47.4% male with 293,531 male residents.
| Gender | Memphis | TN | USA |
|---|---|---|---|
| Female | 52.6% | 50.9% | 50.5% |
| Male | 47.4% | 49.1% | 49.5% |
Highest level of educational attainment in Memphis for adults over 25
See the full breakdown
6.0% of adults in Memphis completed < 9th grade.
8.0% of adults in Memphis completed 9-12th grade.
30.0% of adults in Memphis completed high school / ged.
22.0% of adults in Memphis completed some college.
6.0% of adults in Memphis completed associate's degree.
17.0% of adults in Memphis completed bachelor's degree.
8.0% of adults in Memphis completed master's degree.
2.0% of adults in Memphis completed professional degree.
1.0% of adults in Memphis completed doctorate degree.
| Education | Memphis | TN | USA |
|---|---|---|---|
| < 9th Grade | 6.0% | 4.0% | 4.0% |
| 9-12th Grade | 8.0% | 6.0% | 6.0% |
| High School / GED | 30.0% | 31.0% | 26.0% |
| Some College | 22.0% | 20.0% | 19.0% |
| Associate's Degree | 6.0% | 8.0% | 9.0% |
| Bachelor's Degree | 17.0% | 19.0% | 22.0% |
| Master's Degree | 8.0% | 8.0% | 10.0% |
| Professional Degree | 2.0% | 2.0% | 2.0% |
| Doctorate Degree | 1.0% | 2.0% | 2.0% |
Household Income For Memphis, Tennessee
See the full breakdown
9.2% of households in Memphis earn Less than $10,000.
5.5% of households in Memphis earn $10,000 to $14,999.
9.6% of households in Memphis earn $15,000 to $24,999.
9.7% of households in Memphis earn $25,000 to $34,999.
14.4% of households in Memphis earn $35,000 to $49,999.
17.9% of households in Memphis earn $50,000 to $74,999.
11.1% of households in Memphis earn $75,000 to $99,999.
12.2% of households in Memphis earn $100,000 to $149,999.
4.5% of households in Memphis earn $150,000 to $199,999.
5.8% of households in Memphis earn $200,000 or more.
| Income | Memphis | TN | USA |
|---|---|---|---|
| Less than $10,000 | 9.2% | 5.2% | 5.0% |
| $10,000 to $14,999 | 5.5% | 4.0% | 3.4% |
| $15,000 to $24,999 | 9.6% | 7.4% | 6.3% |
| $25,000 to $34,999 | 9.7% | 7.4% | 6.6% |
| $35,000 to $49,999 | 14.4% | 12.0% | 10.1% |
| $50,000 to $74,999 | 17.9% | 17.3% | 15.5% |
| $75,000 to $99,999 | 11.1% | 13.2% | 12.6% |
| $100,000 to $149,999 | 12.2% | 16.8% | 17.5% |
| $150,000 to $199,999 | 4.5% | 7.7% | 9.6% |
| $200,000 or more | 5.8% | 9.0% | 13.4% |
Source: U.S. Census ACS 5-year estimates (2024)


