Pigeon Forge SnackAbility
Overall SnackAbility
Crime in Pigeon Forge summary. We use data from the FBI to determine the crime rates in Pigeon Forge. Key points include:
There were 251 total crimes in Pigeon Forge in the last reporting year.
The overall crime rate per 100,000 people in Pigeon Forge is 3,956.5 / 100k people.
The violent crime rate per 100,000 people in Pigeon Forge is 788.1 / 100k people.
The property crime rate per 100,000 people in Pigeon Forge is 3,168.3 / 100k people.
Overall, crime in Pigeon Forge is 86.69% above the national average.
Total Crimes
Above National Average
Crime In Pigeon Forge Comparison Table
| Statistic | Count Raw |
Pigeon Forge / 100k People |
Tennessee / 100k People |
National / 100k People |
|---|---|---|---|---|
| Total Crimes Per 100K | 251 | 3,956.5 | 2,624.4 | 2,119.2 |
| Violent Crime | 50 | 788.1 | 592.3 | 359.0 |
| Murder | 1 | 15.8 | 7.9 | 5.0 |
| Robbery | 1 | 15.8 | 58.4 | 61.0 |
| Aggravated Assault | 36 | 567.5 | 488.6 | 256.0 |
| Property Crime | 201 | 3,168.3 | 2,032.1 | 1,760.0 |
| Burglary | 14 | 220.7 | 251.8 | 229.0 |
| Larceny | 173 | 2,727.0 | 1,443.6 | 1,272.0 |
| Car Theft | 14 | 220.7 | 336.7 | 259.0 |
Source: FBI Uniform Crime Reporting (2024)
Cost of living in Pigeon Forge summary. We use data on the cost of living to determine how expensive it is to live in Pigeon Forge. Real estate prices drive most of the variance in cost of living around Tennessee. Key points include:
The cost of living in Pigeon Forge is 96 with 100 being average.
The cost of living in Pigeon Forge is 1.0x lower than the national average.
The median home value in Pigeon Forge is $423,693.
The median income in Pigeon Forge is $53,261.
Pigeon Forge's Overall Cost Of Living
Lower Than The National Average
Cost Of Living In Pigeon Forge Comparison Table
| Living Expense | Pigeon Forge | Tennessee | National Average |
|---|---|---|---|
| Overall | 96 | 94 | 100 |
| Services | 95 | 99 | 100 |
| Groceries | 100 | 96 | 100 |
| Health | 94 | 82 | 100 |
| Housing | 96 | 95 | 100 |
| Transportation | 96 | 99 | 100 |
| Utilities | 97 | 98 | 100 |
Source: Cost of living index, normalized to US average = 100
Pigeon Forge, TN Weather
The average high in Pigeon Forge is 69.4° and the average low is 46.7°.
There are 81.6 days of precipitation each year.
Expect an average of 47.8 inches of precipitation each year with 6.7 inches of snow.
| Stat | Pigeon Forge |
|---|---|
| Average Annual High | 69.4 |
| Average Annual Low | 46.7 |
| Annual Precipitation Days | 81.6 |
| Average Annual Precipitation | 47.8 |
| Average Annual Snowfall | 6.7 |
Average High
Days of Rain
Source: NOAA climate normals (30-year)
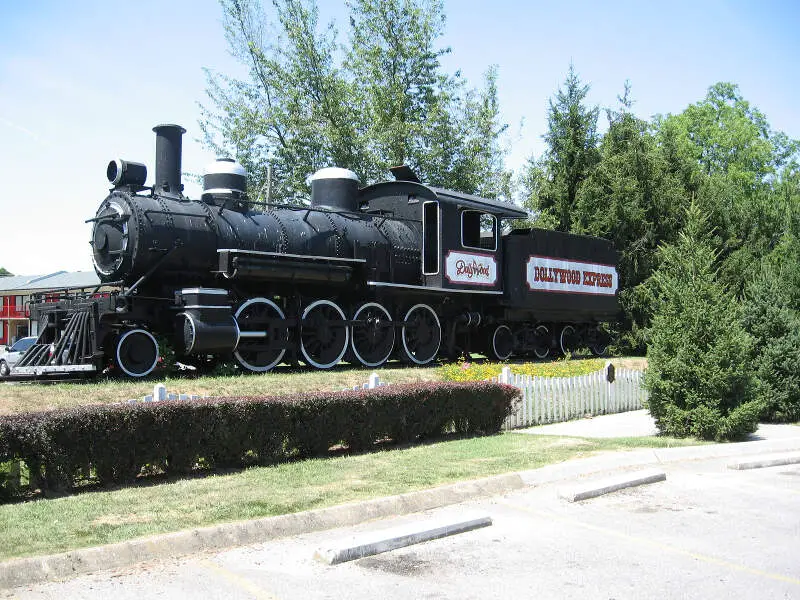
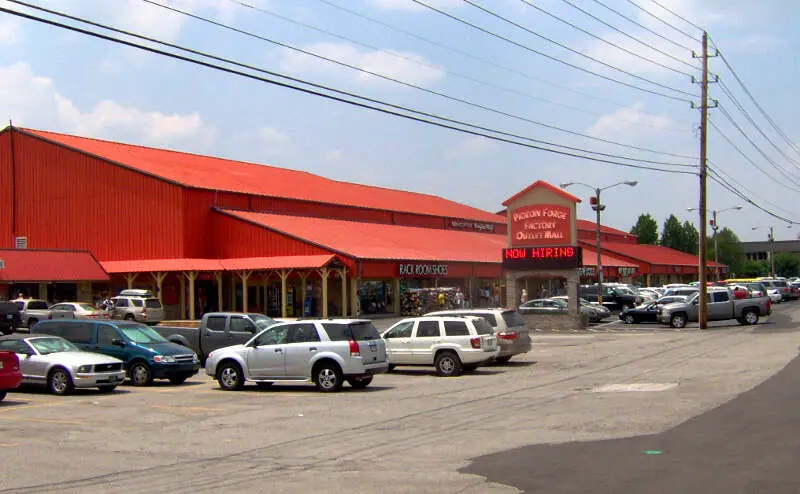
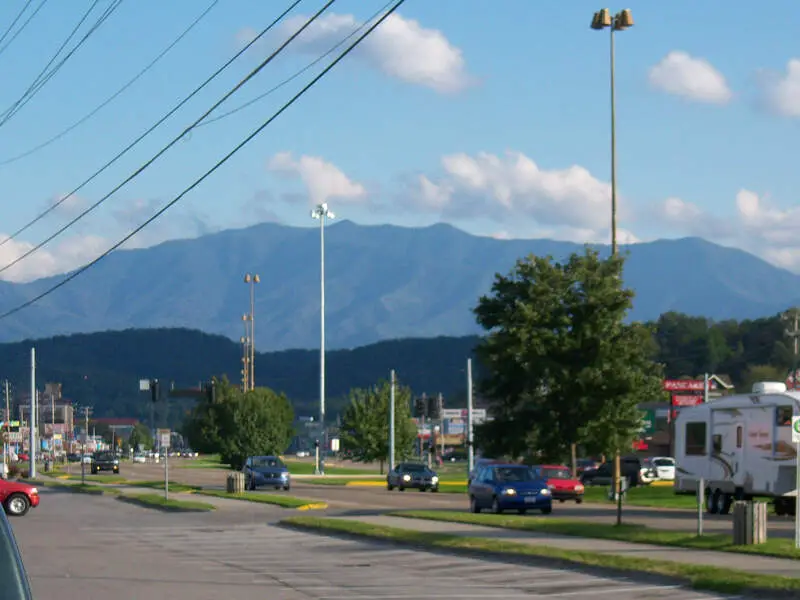
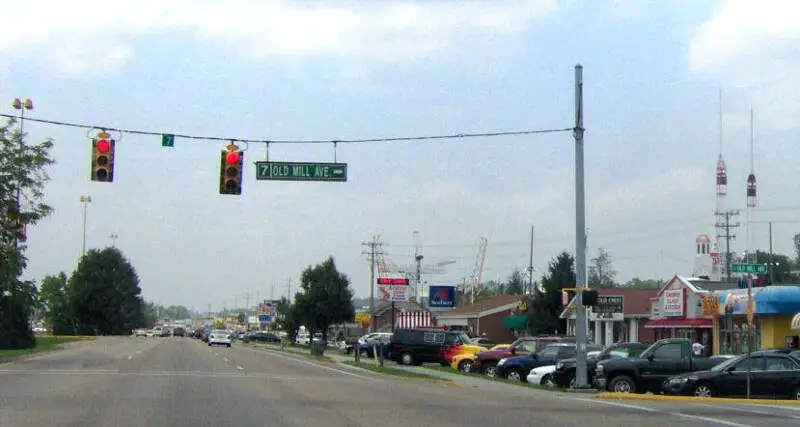
Pigeon Forge, TN Photos
2 Reviews & Comments About Pigeon Forge

I really enjoy this place. They have dinner theaters, lots of shops and local artists. Its fun for adults and kids alike!
The Hatfield and McCoys theater was fun and Dollywood was a blast!
Crime isn't bad
There is a lot to do in town
Scenery is nice
The island-good
Dollywood is nice too
Restraunts are decent
Rankings & Articles For Pigeon Forge


Locations Around Pigeon Forge
Map Of Pigeon Forge, TN
Best Places Around Pigeon Forge
Farragut, TN
Population 24,634
Morristown, TN
Population 31,527
Seymour, TN
Population 16,216
Waynesville, NC
Population 10,502
Oak Ridge, TN
Population 32,693
Sevierville, TN
Population 18,397
Clinton, TN
Population 10,239
Alcoa, TN
Population 12,222
Knoxville, TN
Population 195,185
Pigeon Forge Demographics And Statistics
Population over time in Pigeon Forge
The current population in Pigeon Forge is 6,375. The population has increased 9.3% from 2010.
| Year | Population | % Change |
|---|---|---|
| 2024 | 6,375 | 0.5% |
| 2023 | 6,345 | 0.0% |
| 2022 | 6,345 | -0.3% |
| 2021 | 6,362 | 1.8% |
| 2020 | 6,247 | 0.3% |
| 2019 | 6,229 | 0.5% |
| 2018 | 6,197 | 0.8% |
| 2017 | 6,147 | 0.9% |
| 2016 | 6,092 | 0.9% |
| 2015 | 6,039 | 0.6% |
| 2014 | 6,004 | 1.2% |
| 2013 | 5,933 | 0.3% |
| 2012 | 5,917 | 0.7% |
| 2011 | 5,878 | 0.8% |
| 2010 | 5,831 | - |
Race / Ethnicity in Pigeon Forge
See the full breakdown
Pigeon Forge is:
56.9% White with 3,630 White residents.
1.3% African American with 83 African American residents.
0.0% American Indian with 0 American Indian residents.
1.4% Asian with 91 Asian residents.
0.0% Hawaiian with 0 Hawaiian residents.
0.0% Other with 0 Other residents.
4.5% Two Or More with 286 Two Or More residents.
35.8% Hispanic with 2,285 Hispanic residents.
| Race | Pigeon Forge | TN | USA |
|---|---|---|---|
| White | 56.9% | 71.0% | 57.4% |
| African American | 1.3% | 15.4% | 11.9% |
| American Indian | 0.0% | 0.1% | 0.5% |
| Asian | 1.4% | 1.9% | 5.9% |
| Hawaiian | 0.0% | 0.1% | 0.2% |
| Other | 0.0% | 0.4% | 0.6% |
| Two Or More | 4.5% | 3.7% | 4.3% |
| Hispanic | 35.8% | 7.4% | 19.3% |
Gender in Pigeon Forge
See the full breakdown
Pigeon Forge is 45.1% female with 2,872 female residents.
Pigeon Forge is 54.9% male with 3,502 male residents.
| Gender | Pigeon Forge | TN | USA |
|---|---|---|---|
| Female | 45.1% | 50.9% | 50.5% |
| Male | 54.9% | 49.1% | 49.5% |
Highest level of educational attainment in Pigeon Forge for adults over 25
See the full breakdown
17.0% of adults in Pigeon Forge completed < 9th grade.
8.0% of adults in Pigeon Forge completed 9-12th grade.
37.0% of adults in Pigeon Forge completed high school / ged.
18.0% of adults in Pigeon Forge completed some college.
6.0% of adults in Pigeon Forge completed associate's degree.
11.0% of adults in Pigeon Forge completed bachelor's degree.
2.0% of adults in Pigeon Forge completed master's degree.
1.0% of adults in Pigeon Forge completed professional degree.
0.0% of adults in Pigeon Forge completed doctorate degree.
| Education | Pigeon Forge | TN | USA |
|---|---|---|---|
| < 9th Grade | 17.0% | 4.0% | 4.0% |
| 9-12th Grade | 8.0% | 6.0% | 6.0% |
| High School / GED | 37.0% | 31.0% | 26.0% |
| Some College | 18.0% | 20.0% | 19.0% |
| Associate's Degree | 6.0% | 8.0% | 9.0% |
| Bachelor's Degree | 11.0% | 19.0% | 22.0% |
| Master's Degree | 2.0% | 8.0% | 10.0% |
| Professional Degree | 1.0% | 2.0% | 2.0% |
| Doctorate Degree | 0.0% | 2.0% | 2.0% |
Household Income For Pigeon Forge, Tennessee
See the full breakdown
8.5% of households in Pigeon Forge earn Less than $10,000.
4.2% of households in Pigeon Forge earn $10,000 to $14,999.
4.5% of households in Pigeon Forge earn $15,000 to $24,999.
13.2% of households in Pigeon Forge earn $25,000 to $34,999.
14.4% of households in Pigeon Forge earn $35,000 to $49,999.
25.0% of households in Pigeon Forge earn $50,000 to $74,999.
15.0% of households in Pigeon Forge earn $75,000 to $99,999.
7.6% of households in Pigeon Forge earn $100,000 to $149,999.
4.7% of households in Pigeon Forge earn $150,000 to $199,999.
2.9% of households in Pigeon Forge earn $200,000 or more.
| Income | Pigeon Forge | TN | USA |
|---|---|---|---|
| Less than $10,000 | 8.5% | 5.2% | 5.0% |
| $10,000 to $14,999 | 4.2% | 4.0% | 3.4% |
| $15,000 to $24,999 | 4.5% | 7.4% | 6.3% |
| $25,000 to $34,999 | 13.2% | 7.4% | 6.6% |
| $35,000 to $49,999 | 14.4% | 12.0% | 10.1% |
| $50,000 to $74,999 | 25.0% | 17.3% | 15.5% |
| $75,000 to $99,999 | 15.0% | 13.2% | 12.6% |
| $100,000 to $149,999 | 7.6% | 16.8% | 17.5% |
| $150,000 to $199,999 | 4.7% | 7.7% | 9.6% |
| $200,000 or more | 2.9% | 9.0% | 13.4% |
Source: U.S. Census ACS 5-year estimates (2024)


