Belton SnackAbility
Overall SnackAbility
Crime in Belton summary. We use data from the FBI to determine the crime rates in Belton. Key points include:
There were 527 total crimes in Belton in the last reporting year.
The overall crime rate per 100,000 people in Belton is 2,035.7 / 100k people.
The violent crime rate per 100,000 people in Belton is 92.7 / 100k people.
The property crime rate per 100,000 people in Belton is 1,943.0 / 100k people.
Overall, crime in Belton is -3.94% below the national average.
Total Crimes
Below National Average
Crime In Belton Comparison Table
| Statistic | Count Raw |
Belton / 100k People |
Texas / 100k People |
National / 100k People |
|---|---|---|---|---|
| Total Crimes Per 100K | 527 | 2,035.7 | 2,429.9 | 2,119.2 |
| Violent Crime | 24 | 92.7 | 389.4 | 359.0 |
| Murder | 0 | 0.0 | 5.2 | 5.0 |
| Robbery | 0 | 0.0 | 63.5 | 61.0 |
| Aggravated Assault | 11 | 42.5 | 270.7 | 256.0 |
| Property Crime | 503 | 1,943.0 | 2,040.5 | 1,760.0 |
| Burglary | 60 | 231.8 | 284.3 | 229.0 |
| Larceny | 393 | 1,518.1 | 1,425.6 | 1,272.0 |
| Car Theft | 50 | 193.1 | 330.7 | 259.0 |
Source: FBI Uniform Crime Reporting (2024)
Cost of living in Belton summary. We use data on the cost of living to determine how expensive it is to live in Belton. Real estate prices drive most of the variance in cost of living around Texas. Key points include:
The cost of living in Belton is 97 with 100 being average.
The cost of living in Belton is 1.0x lower than the national average.
The median home value in Belton is $314,940.
The median income in Belton is $59,130.
Belton's Overall Cost Of Living
Lower Than The National Average
Cost Of Living In Belton Comparison Table
| Living Expense | Belton | Texas | National Average |
|---|---|---|---|
| Overall | 97 | 93 | 100 |
| Services | 97 | 100 | 100 |
| Groceries | 99 | 99 | 100 |
| Health | 91 | 81 | 100 |
| Housing | 99 | 97 | 100 |
| Transportation | 104 | 103 | 100 |
| Utilities | 96 | 100 | 100 |
Source: Cost of living index, normalized to US average = 100
Belton, TX Weather
The average high in Belton is 77.8° and the average low is 54.9°.
There are 54.5 days of precipitation each year.
Expect an average of 35.7 inches of precipitation each year with 0.1 inches of snow.
| Stat | Belton |
|---|---|
| Average Annual High | 77.8 |
| Average Annual Low | 54.9 |
| Annual Precipitation Days | 54.5 |
| Average Annual Precipitation | 35.7 |
| Average Annual Snowfall | 0.1 |
Average High
Days of Rain
Source: NOAA climate normals (30-year)
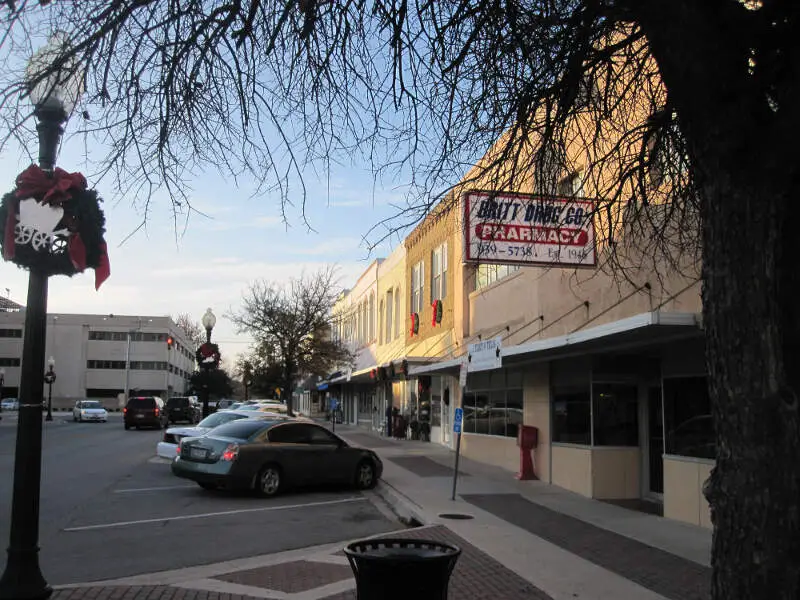
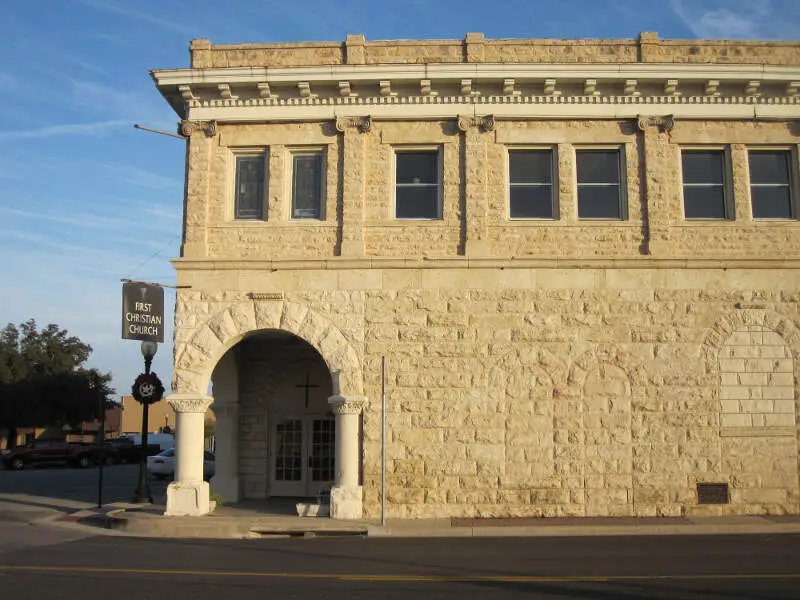
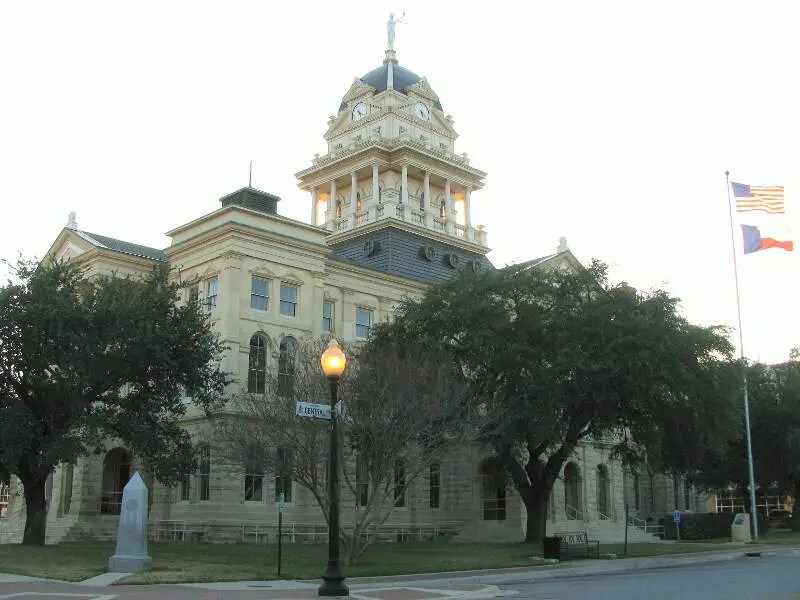
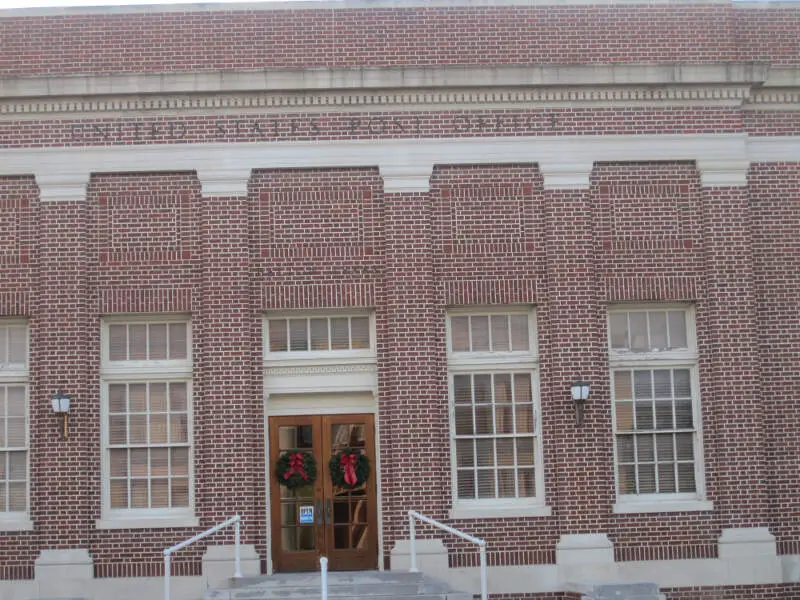
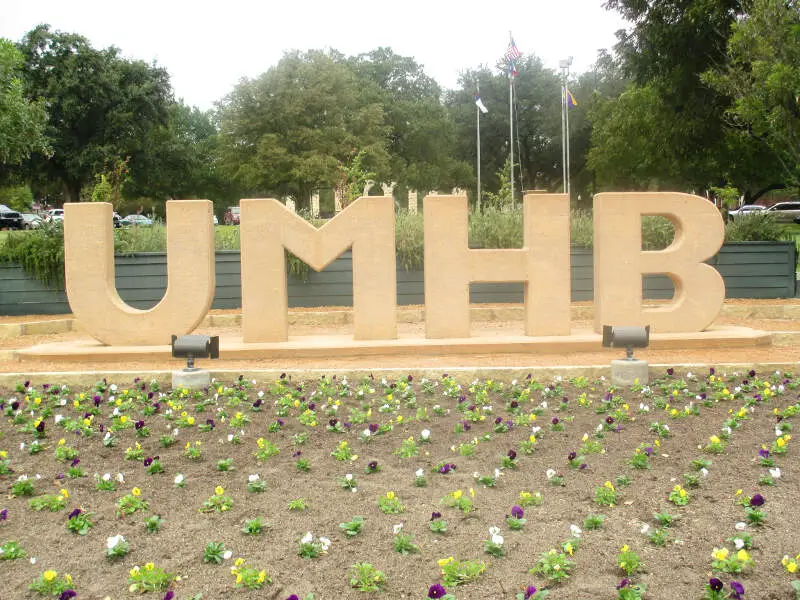
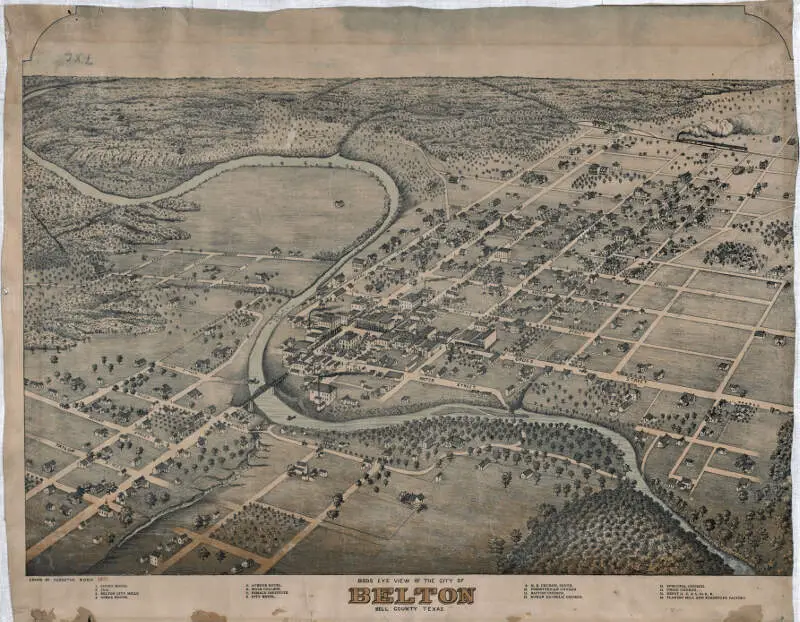
Belton, TX Photos


Rankings & Articles For Belton


Locations Around Belton
Map Of Belton, TX
Best Places Around Belton
Brushy Creek, TX
Population 19,576
Cedar Park, TX
Population 78,301
Hewitt, TX
Population 16,432
Round Rock, TX
Population 127,786
Pflugerville, TX
Population 65,971
Robinson, TX
Population 12,800
Hutto, TX
Population 35,483
Leander, TX
Population 74,067
Georgetown, TX
Population 85,999
Wells Branch, TX
Population 13,523
Belton Demographics And Statistics
Population over time in Belton
The current population in Belton is 24,356. The population has increased 36.5% from 2010.
| Year | Population | % Change |
|---|---|---|
| 2024 | 24,356 | 2.5% |
| 2023 | 23,769 | 2.7% |
| 2022 | 23,137 | 1.2% |
| 2021 | 22,866 | 3.1% |
| 2020 | 22,173 | 2.3% |
| 2019 | 21,685 | 2.7% |
| 2018 | 21,123 | 2.4% |
| 2017 | 20,635 | 2.5% |
| 2016 | 20,138 | 1.9% |
| 2015 | 19,766 | 2.5% |
| 2014 | 19,292 | 2.3% |
| 2013 | 18,855 | 1.7% |
| 2012 | 18,539 | 2.4% |
| 2011 | 18,108 | 1.5% |
| 2010 | 17,845 | - |
Race / Ethnicity in Belton
See the full breakdown
Belton is:
53.9% White with 13,116 White residents.
6.4% African American with 1,555 African American residents.
0.1% American Indian with 19 American Indian residents.
1.2% Asian with 298 Asian residents.
0.0% Hawaiian with 0 Hawaiian residents.
0.1% Other with 20 Other residents.
5.8% Two Or More with 1,417 Two Or More residents.
32.6% Hispanic with 7,931 Hispanic residents.
| Race | Belton | TX | USA |
|---|---|---|---|
| White | 53.9% | 39.1% | 57.4% |
| African American | 6.4% | 11.9% | 11.9% |
| American Indian | 0.1% | 0.1% | 0.5% |
| Asian | 1.2% | 5.5% | 5.9% |
| Hawaiian | 0.0% | 0.1% | 0.2% |
| Other | 0.1% | 0.4% | 0.6% |
| Two Or More | 5.8% | 3.1% | 4.3% |
| Hispanic | 32.6% | 39.7% | 19.3% |
Gender in Belton
See the full breakdown
Belton is 52.5% female with 12,798 female residents.
Belton is 47.5% male with 11,558 male residents.
| Gender | Belton | TX | USA |
|---|---|---|---|
| Female | 52.5% | 50.1% | 50.5% |
| Male | 47.5% | 49.9% | 49.5% |
Highest level of educational attainment in Belton for adults over 25
See the full breakdown
6.0% of adults in Belton completed < 9th grade.
8.0% of adults in Belton completed 9-12th grade.
29.0% of adults in Belton completed high school / ged.
22.0% of adults in Belton completed some college.
7.0% of adults in Belton completed associate's degree.
20.0% of adults in Belton completed bachelor's degree.
5.0% of adults in Belton completed master's degree.
2.0% of adults in Belton completed professional degree.
1.0% of adults in Belton completed doctorate degree.
| Education | Belton | TX | USA |
|---|---|---|---|
| < 9th Grade | 6.0% | 8.0% | 4.0% |
| 9-12th Grade | 8.0% | 7.0% | 6.0% |
| High School / GED | 29.0% | 24.0% | 26.0% |
| Some College | 22.0% | 20.0% | 19.0% |
| Associate's Degree | 7.0% | 8.0% | 9.0% |
| Bachelor's Degree | 20.0% | 21.0% | 22.0% |
| Master's Degree | 5.0% | 9.0% | 10.0% |
| Professional Degree | 2.0% | 2.0% | 2.0% |
| Doctorate Degree | 1.0% | 1.0% | 2.0% |
Household Income For Belton, Texas
See the full breakdown
6.7% of households in Belton earn Less than $10,000.
5.8% of households in Belton earn $10,000 to $14,999.
7.9% of households in Belton earn $15,000 to $24,999.
8.1% of households in Belton earn $25,000 to $34,999.
12.5% of households in Belton earn $35,000 to $49,999.
17.7% of households in Belton earn $50,000 to $74,999.
10.2% of households in Belton earn $75,000 to $99,999.
17.2% of households in Belton earn $100,000 to $149,999.
3.4% of households in Belton earn $150,000 to $199,999.
10.6% of households in Belton earn $200,000 or more.
| Income | Belton | TX | USA |
|---|---|---|---|
| Less than $10,000 | 6.7% | 5.0% | 5.0% |
| $10,000 to $14,999 | 5.8% | 3.3% | 3.4% |
| $15,000 to $24,999 | 7.9% | 6.3% | 6.3% |
| $25,000 to $34,999 | 8.1% | 6.8% | 6.6% |
| $35,000 to $49,999 | 12.5% | 10.5% | 10.1% |
| $50,000 to $74,999 | 17.7% | 16.1% | 15.5% |
| $75,000 to $99,999 | 10.2% | 12.8% | 12.6% |
| $100,000 to $149,999 | 17.2% | 17.3% | 17.5% |
| $150,000 to $199,999 | 3.4% | 9.5% | 9.6% |
| $200,000 or more | 10.6% | 12.5% | 13.4% |
Source: U.S. Census ACS 5-year estimates (2024)


