Sherman SnackAbility
Overall SnackAbility
Crime in Sherman summary. We use data from the FBI to determine the crime rates in Sherman. Key points include:
There were 1,104 total crimes in Sherman in the last reporting year.
The overall crime rate per 100,000 people in Sherman is 2,266.4 / 100k people.
The violent crime rate per 100,000 people in Sherman is 353.1 / 100k people.
The property crime rate per 100,000 people in Sherman is 1,913.3 / 100k people.
Overall, crime in Sherman is 6.95% above the national average.
Total Crimes
Above National Average
Crime In Sherman Comparison Table
| Statistic | Count Raw |
Sherman / 100k People |
Texas / 100k People |
National / 100k People |
|---|---|---|---|---|
| Total Crimes Per 100K | 1,104 | 2,266.4 | 2,429.9 | 2,119.2 |
| Violent Crime | 172 | 353.1 | 389.4 | 359.0 |
| Murder | 1 | 2.1 | 5.2 | 5.0 |
| Robbery | 18 | 37.0 | 63.5 | 61.0 |
| Aggravated Assault | 119 | 244.3 | 270.7 | 256.0 |
| Property Crime | 932 | 1,913.3 | 2,040.5 | 1,760.0 |
| Burglary | 291 | 597.4 | 284.3 | 229.0 |
| Larceny | 555 | 1,139.4 | 1,425.6 | 1,272.0 |
| Car Theft | 86 | 176.6 | 330.7 | 259.0 |
Source: FBI Uniform Crime Reporting (2024)
Cost of living in Sherman summary. We use data on the cost of living to determine how expensive it is to live in Sherman. Real estate prices drive most of the variance in cost of living around Texas. Key points include:
The cost of living in Sherman is 93 with 100 being average.
The cost of living in Sherman is 0.9x lower than the national average.
The median home value in Sherman is $257,920.
The median income in Sherman is $58,859.
Sherman's Overall Cost Of Living
Lower Than The National Average
Cost Of Living In Sherman Comparison Table
| Living Expense | Sherman | Texas | National Average |
|---|---|---|---|
| Overall | 93 | 93 | 100 |
| Services | 97 | 100 | 100 |
| Groceries | 103 | 99 | 100 |
| Health | 81 | 81 | 100 |
| Housing | 99 | 97 | 100 |
| Transportation | 102 | 103 | 100 |
| Utilities | 102 | 100 | 100 |
Source: Cost of living index, normalized to US average = 100
Sherman, TX Weather
The average high in Sherman is 73.8° and the average low is 52.7°.
There are 60.5 days of precipitation each year.
Expect an average of 42.0 inches of precipitation each year with 1.2 inches of snow.
| Stat | Sherman |
|---|---|
| Average Annual High | 73.8 |
| Average Annual Low | 52.7 |
| Annual Precipitation Days | 60.5 |
| Average Annual Precipitation | 42.0 |
| Average Annual Snowfall | 1.2 |
Average High
Days of Rain
Source: NOAA climate normals (30-year)
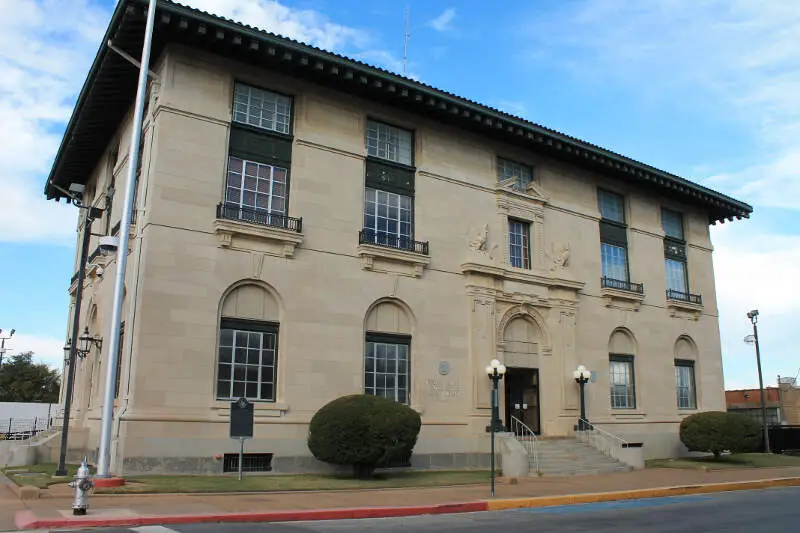
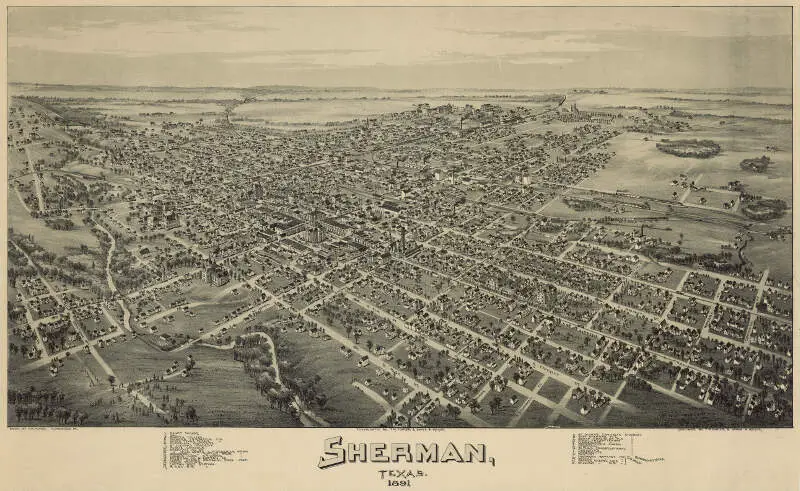
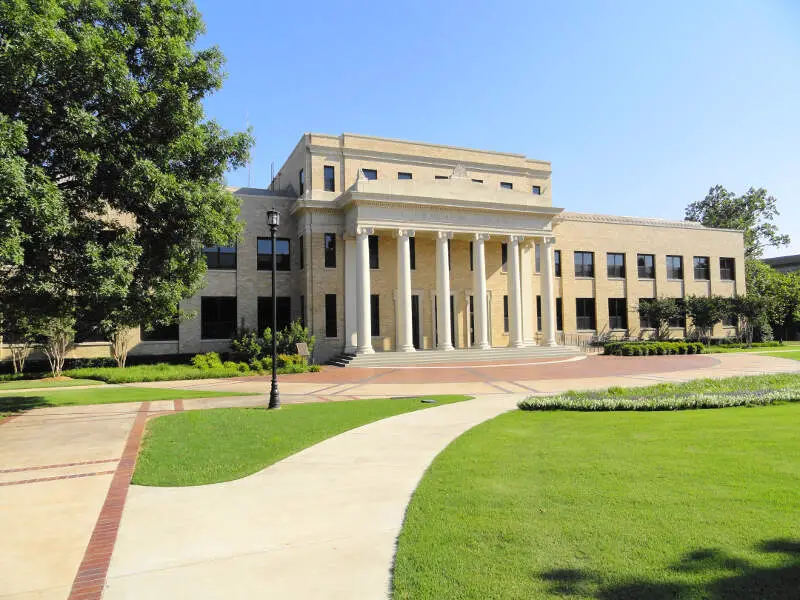
Sherman, TX Photos
Rankings & Articles For Sherman


Locations Around Sherman
Map Of Sherman, TX
Best Places Around Sherman
Murphy, TX
Population 21,188
Allen, TX
Population 110,265
Corinth, TX
Population 23,385
Plano, TX
Population 290,594
Flower Mound, TX
Population 78,389
Frisco, TX
Population 219,304
Carrollton, TX
Population 133,740
Richardson, TX
Population 118,731
McKinney, TX
Population 210,600
The Colony, TX
Population 45,454
Sherman Demographics And Statistics
Population over time in Sherman
The current population in Sherman is 46,397. The population has increased 22.3% from 2010.
| Year | Population | % Change |
|---|---|---|
| 2024 | 46,397 | 3.0% |
| 2023 | 45,036 | 2.2% |
| 2022 | 44,052 | 1.8% |
| 2021 | 43,273 | 0.1% |
| 2020 | 43,239 | 1.9% |
| 2019 | 42,432 | 3.1% |
| 2018 | 41,149 | 1.5% |
| 2017 | 40,543 | 1.1% |
| 2016 | 40,112 | 1.4% |
| 2015 | 39,569 | 1.2% |
| 2014 | 39,119 | 0.8% |
| 2013 | 38,805 | 0.8% |
| 2012 | 38,499 | 0.7% |
| 2011 | 38,214 | 0.7% |
| 2010 | 37,943 | - |
Race / Ethnicity in Sherman
See the full breakdown
Sherman is:
61.0% White with 28,321 White residents.
9.4% African American with 4,346 African American residents.
0.2% American Indian with 100 American Indian residents.
2.5% Asian with 1,179 Asian residents.
0.3% Hawaiian with 135 Hawaiian residents.
0.8% Other with 355 Other residents.
4.6% Two Or More with 2,142 Two Or More residents.
21.2% Hispanic with 9,819 Hispanic residents.
| Race | Sherman | TX | USA |
|---|---|---|---|
| White | 61.0% | 39.1% | 57.4% |
| African American | 9.4% | 11.9% | 11.9% |
| American Indian | 0.2% | 0.1% | 0.5% |
| Asian | 2.5% | 5.5% | 5.9% |
| Hawaiian | 0.3% | 0.1% | 0.2% |
| Other | 0.8% | 0.4% | 0.6% |
| Two Or More | 4.6% | 3.1% | 4.3% |
| Hispanic | 21.2% | 39.7% | 19.3% |
Gender in Sherman
See the full breakdown
Sherman is 51.1% female with 23,711 female residents.
Sherman is 48.9% male with 22,685 male residents.
| Gender | Sherman | TX | USA |
|---|---|---|---|
| Female | 51.1% | 50.1% | 50.5% |
| Male | 48.9% | 49.9% | 49.5% |
Highest level of educational attainment in Sherman for adults over 25
See the full breakdown
5.0% of adults in Sherman completed < 9th grade.
6.0% of adults in Sherman completed 9-12th grade.
31.0% of adults in Sherman completed high school / ged.
23.0% of adults in Sherman completed some college.
11.0% of adults in Sherman completed associate's degree.
15.0% of adults in Sherman completed bachelor's degree.
6.0% of adults in Sherman completed master's degree.
2.0% of adults in Sherman completed professional degree.
1.0% of adults in Sherman completed doctorate degree.
| Education | Sherman | TX | USA |
|---|---|---|---|
| < 9th Grade | 5.0% | 8.0% | 4.0% |
| 9-12th Grade | 6.0% | 7.0% | 6.0% |
| High School / GED | 31.0% | 24.0% | 26.0% |
| Some College | 23.0% | 20.0% | 19.0% |
| Associate's Degree | 11.0% | 8.0% | 9.0% |
| Bachelor's Degree | 15.0% | 21.0% | 22.0% |
| Master's Degree | 6.0% | 9.0% | 10.0% |
| Professional Degree | 2.0% | 2.0% | 2.0% |
| Doctorate Degree | 1.0% | 1.0% | 2.0% |
Household Income For Sherman, Texas
See the full breakdown
3.6% of households in Sherman earn Less than $10,000.
4.6% of households in Sherman earn $10,000 to $14,999.
5.8% of households in Sherman earn $15,000 to $24,999.
8.6% of households in Sherman earn $25,000 to $34,999.
18.5% of households in Sherman earn $35,000 to $49,999.
20.9% of households in Sherman earn $50,000 to $74,999.
11.5% of households in Sherman earn $75,000 to $99,999.
16.2% of households in Sherman earn $100,000 to $149,999.
5.2% of households in Sherman earn $150,000 to $199,999.
5.2% of households in Sherman earn $200,000 or more.
| Income | Sherman | TX | USA |
|---|---|---|---|
| Less than $10,000 | 3.6% | 5.0% | 5.0% |
| $10,000 to $14,999 | 4.6% | 3.3% | 3.4% |
| $15,000 to $24,999 | 5.8% | 6.3% | 6.3% |
| $25,000 to $34,999 | 8.6% | 6.8% | 6.6% |
| $35,000 to $49,999 | 18.5% | 10.5% | 10.1% |
| $50,000 to $74,999 | 20.9% | 16.1% | 15.5% |
| $75,000 to $99,999 | 11.5% | 12.8% | 12.6% |
| $100,000 to $149,999 | 16.2% | 17.3% | 17.5% |
| $150,000 to $199,999 | 5.2% | 9.5% | 9.6% |
| $200,000 or more | 5.2% | 12.5% | 13.4% |
Source: U.S. Census ACS 5-year estimates (2024)


