Pleasant Grove SnackAbility
Overall SnackAbility
Crime in Pleasant Grove summary. We use data from the FBI to determine the crime rates in Pleasant Grove. Key points include:
There were 339 total crimes in Pleasant Grove in the last reporting year.
The overall crime rate per 100,000 people in Pleasant Grove is 912.6 / 100k people.
The violent crime rate per 100,000 people in Pleasant Grove is 204.6 / 100k people.
The property crime rate per 100,000 people in Pleasant Grove is 708.0 / 100k people.
Overall, crime in Pleasant Grove is -56.94% below the national average.
Total Crimes
Below National Average
Crime In Pleasant Grove Comparison Table
| Statistic | Count Raw |
Pleasant Grove / 100k People |
Utah / 100k People |
National / 100k People |
|---|---|---|---|---|
| Total Crimes Per 100K | 339 | 912.6 | 1,638.5 | 2,119.2 |
| Violent Crime | 76 | 204.6 | 229.6 | 359.0 |
| Murder | 0 | 0.0 | 2.6 | 5.0 |
| Robbery | 3 | 8.1 | 27.3 | 61.0 |
| Aggravated Assault | 37 | 99.6 | 141.7 | 256.0 |
| Property Crime | 263 | 708.0 | 1,408.9 | 1,760.0 |
| Burglary | 43 | 115.8 | 146.6 | 229.0 |
| Larceny | 198 | 533.0 | 1,145.8 | 1,272.0 |
| Car Theft | 22 | 59.2 | 116.5 | 259.0 |
Source: FBI Uniform Crime Reporting (2024)
Cost of living in Pleasant Grove summary. We use data on the cost of living to determine how expensive it is to live in Pleasant Grove. Real estate prices drive most of the variance in cost of living around Utah. Key points include:
The cost of living in Pleasant Grove is 119 with 100 being average.
The cost of living in Pleasant Grove is 1.2x higher than the national average.
The median home value in Pleasant Grove is $555,047.
The median income in Pleasant Grove is $101,073.
Pleasant Grove's Overall Cost Of Living
Higher Than The National Average
Cost Of Living In Pleasant Grove Comparison Table
| Living Expense | Pleasant Grove | Utah | National Average |
|---|---|---|---|
| Overall | 119 | 106 | 100 |
| Services | 101 | 100 | 100 |
| Groceries | 101 | 101 | 100 |
| Health | 166 | 111 | 100 |
| Housing | 102 | 103 | 100 |
| Transportation | 101 | 103 | 100 |
| Utilities | 101 | 103 | 100 |
Source: Cost of living index, normalized to US average = 100
Pleasant Grove, UT Weather
The average high in Pleasant Grove is 63.8° and the average low is 38.5°.
There are 50.3 days of precipitation each year.
Expect an average of 18.1 inches of precipitation each year with 51.1 inches of snow.
| Stat | Pleasant Grove |
|---|---|
| Average Annual High | 63.8 |
| Average Annual Low | 38.5 |
| Annual Precipitation Days | 50.3 |
| Average Annual Precipitation | 18.1 |
| Average Annual Snowfall | 51.1 |
Average High
Days of Rain
Source: NOAA climate normals (30-year)
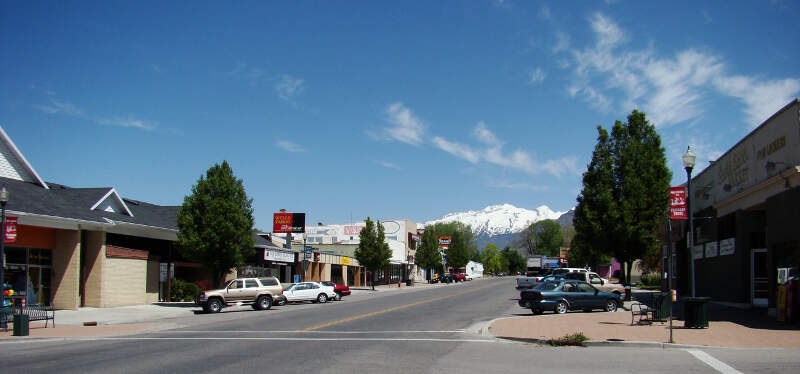
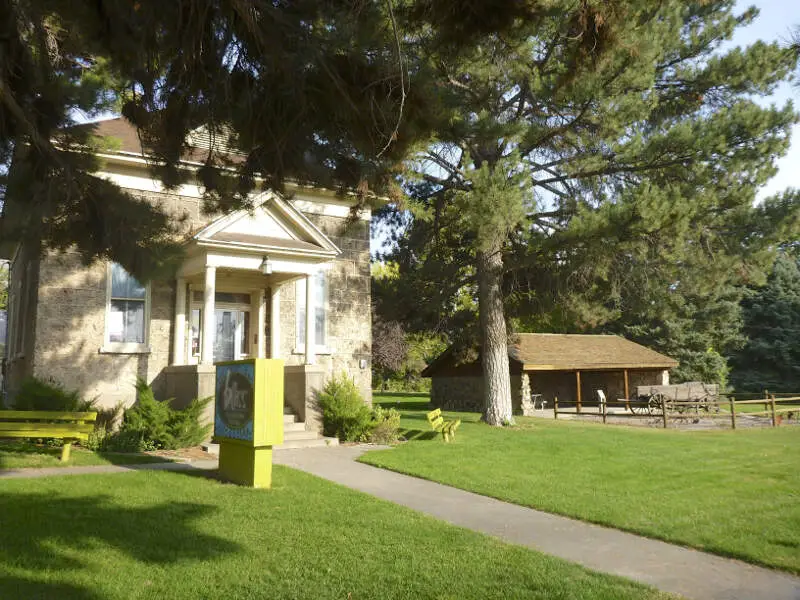
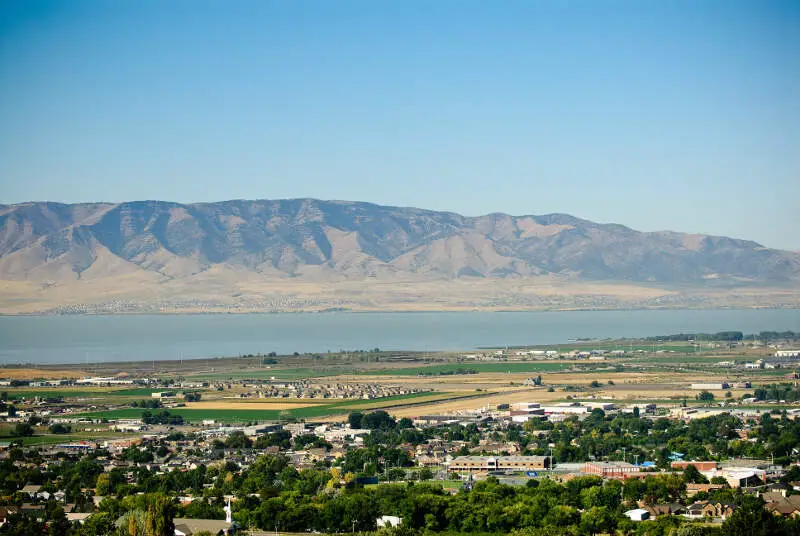
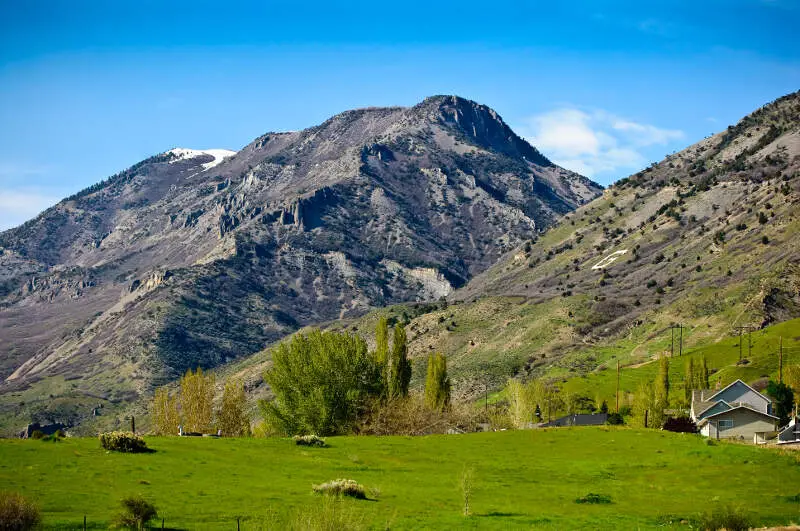
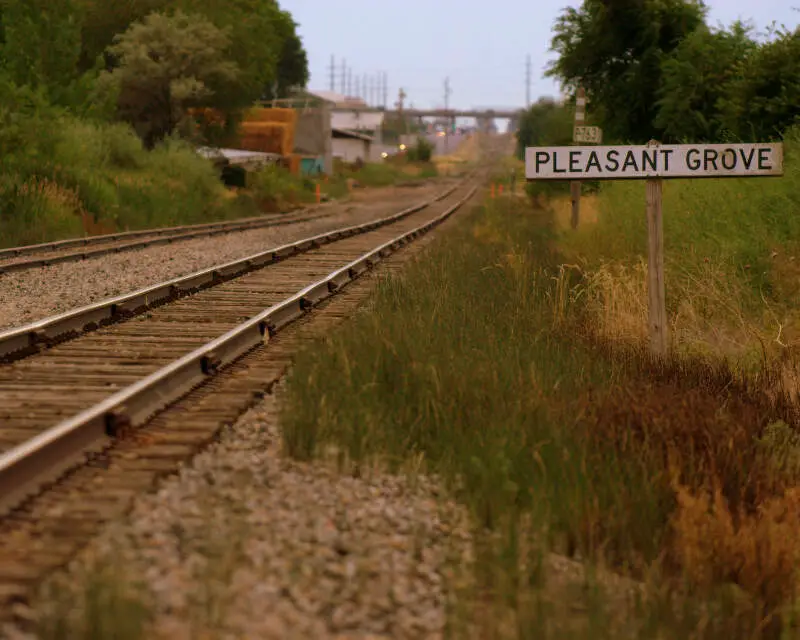
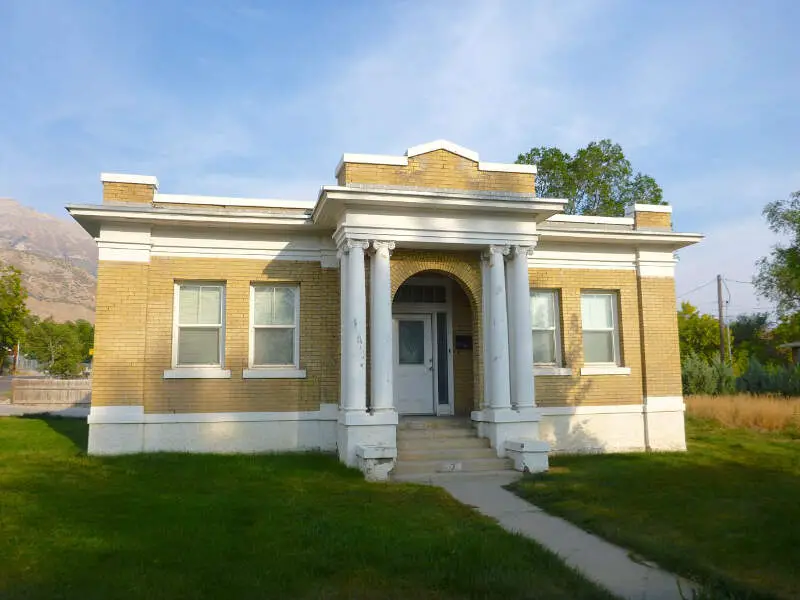
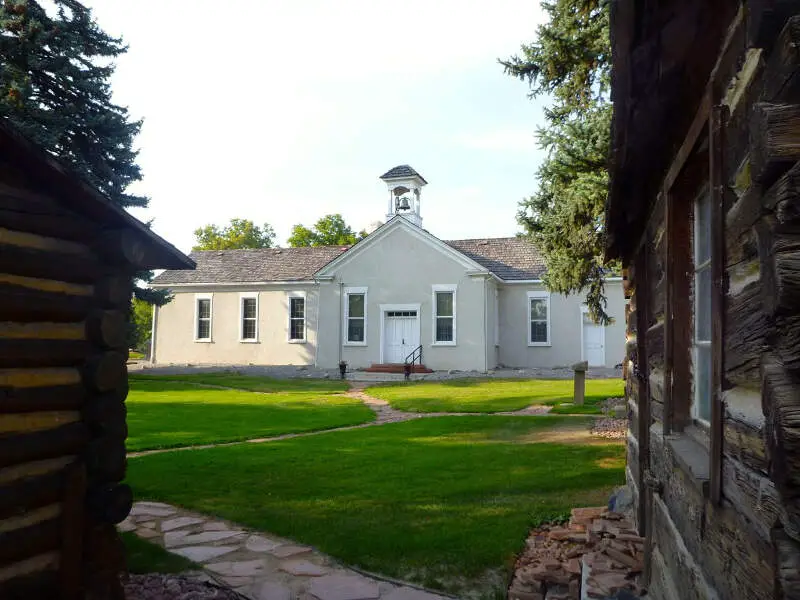
Pleasant Grove, UT Photos
Rankings & Articles For Pleasant Grove


Locations Around Pleasant Grove
Map Of Pleasant Grove, UT
Best Places Around Pleasant Grove
South Jordan, UT
Population 82,686
Cedar Hills, UT
Population 9,950
Riverton, UT
Population 45,457
Highland, UT
Population 20,119
Cottonwood Heights, UT
Population 32,828
Draper, UT
Population 50,278
Sandy, UT
Population 94,291
Lehi, UT
Population 85,173
Alpine, UT
Population 10,392
Herriman, UT
Population 59,346
Pleasant Grove Demographics And Statistics
Population over time in Pleasant Grove
The current population in Pleasant Grove is 37,852. The population has increased 20.3% from 2010.
| Year | Population | % Change |
|---|---|---|
| 2024 | 37,852 | 0.8% |
| 2023 | 37,544 | 0.2% |
| 2022 | 37,453 | 0.6% |
| 2021 | 37,228 | -3.2% |
| 2020 | 38,474 | 0.2% |
| 2019 | 38,380 | 0.8% |
| 2018 | 38,066 | 1.7% |
| 2017 | 37,439 | 2.1% |
| 2016 | 36,678 | 2.5% |
| 2015 | 35,771 | 2.6% |
| 2014 | 34,858 | 2.5% |
| 2013 | 34,010 | 2.0% |
| 2012 | 33,330 | 2.3% |
| 2011 | 32,565 | 3.5% |
| 2010 | 31,457 | - |
Race / Ethnicity in Pleasant Grove
See the full breakdown
Pleasant Grove is:
80.1% White with 30,337 White residents.
0.4% African American with 170 African American residents.
0.1% American Indian with 40 American Indian residents.
2.2% Asian with 826 Asian residents.
0.8% Hawaiian with 286 Hawaiian residents.
0.3% Other with 130 Other residents.
3.0% Two Or More with 1,118 Two Or More residents.
13.1% Hispanic with 4,945 Hispanic residents.
| Race | Pleasant Grove | UT | USA |
|---|---|---|---|
| White | 80.1% | 74.7% | 57.4% |
| African American | 0.4% | 1.1% | 11.9% |
| American Indian | 0.1% | 0.6% | 0.5% |
| Asian | 2.2% | 2.4% | 5.9% |
| Hawaiian | 0.8% | 0.9% | 0.2% |
| Other | 0.3% | 0.4% | 0.6% |
| Two Or More | 3.0% | 4.0% | 4.3% |
| Hispanic | 13.1% | 15.9% | 19.3% |
Gender in Pleasant Grove
See the full breakdown
Pleasant Grove is 48.4% female with 18,307 female residents.
Pleasant Grove is 51.6% male with 19,545 male residents.
| Gender | Pleasant Grove | UT | USA |
|---|---|---|---|
| Female | 48.4% | 49.3% | 50.5% |
| Male | 51.6% | 50.7% | 49.5% |
Highest level of educational attainment in Pleasant Grove for adults over 25
See the full breakdown
2.0% of adults in Pleasant Grove completed < 9th grade.
3.0% of adults in Pleasant Grove completed 9-12th grade.
19.0% of adults in Pleasant Grove completed high school / ged.
25.0% of adults in Pleasant Grove completed some college.
9.0% of adults in Pleasant Grove completed associate's degree.
29.0% of adults in Pleasant Grove completed bachelor's degree.
10.0% of adults in Pleasant Grove completed master's degree.
1.0% of adults in Pleasant Grove completed professional degree.
2.0% of adults in Pleasant Grove completed doctorate degree.
| Education | Pleasant Grove | UT | USA |
|---|---|---|---|
| < 9th Grade | 2.0% | 2.0% | 4.0% |
| 9-12th Grade | 3.0% | 4.0% | 6.0% |
| High School / GED | 19.0% | 22.0% | 26.0% |
| Some College | 25.0% | 23.0% | 19.0% |
| Associate's Degree | 9.0% | 10.0% | 9.0% |
| Bachelor's Degree | 29.0% | 25.0% | 22.0% |
| Master's Degree | 10.0% | 10.0% | 10.0% |
| Professional Degree | 1.0% | 2.0% | 2.0% |
| Doctorate Degree | 2.0% | 2.0% | 2.0% |
Household Income For Pleasant Grove, Utah
See the full breakdown
2.5% of households in Pleasant Grove earn Less than $10,000.
0.6% of households in Pleasant Grove earn $10,000 to $14,999.
3.0% of households in Pleasant Grove earn $15,000 to $24,999.
3.7% of households in Pleasant Grove earn $25,000 to $34,999.
6.5% of households in Pleasant Grove earn $35,000 to $49,999.
12.8% of households in Pleasant Grove earn $50,000 to $74,999.
19.5% of households in Pleasant Grove earn $75,000 to $99,999.
25.3% of households in Pleasant Grove earn $100,000 to $149,999.
10.6% of households in Pleasant Grove earn $150,000 to $199,999.
15.4% of households in Pleasant Grove earn $200,000 or more.
| Income | Pleasant Grove | UT | USA |
|---|---|---|---|
| Less than $10,000 | 2.5% | 3.1% | 5.0% |
| $10,000 to $14,999 | 0.6% | 2.0% | 3.4% |
| $15,000 to $24,999 | 3.0% | 4.0% | 6.3% |
| $25,000 to $34,999 | 3.7% | 5.0% | 6.6% |
| $35,000 to $49,999 | 6.5% | 8.8% | 10.1% |
| $50,000 to $74,999 | 12.8% | 15.5% | 15.5% |
| $75,000 to $99,999 | 19.5% | 14.2% | 12.6% |
| $100,000 to $149,999 | 25.3% | 21.6% | 17.5% |
| $150,000 to $199,999 | 10.6% | 11.9% | 9.6% |
| $200,000 or more | 15.4% | 13.9% | 13.4% |
Source: U.S. Census ACS 5-year estimates (2024)


