Fort Belvoir SnackAbility
Overall SnackAbility
Cost of living in Fort Belvoir summary. We use data on the cost of living to determine how expensive it is to live in Fort Belvoir. Real estate prices drive most of the variance in cost of living around Virginia. Key points include:
The cost of living in Fort Belvoir is 158 with 100 being average.
The cost of living in Fort Belvoir is 1.6x higher than the national average.
The median home value in Fort Belvoir is $800,571.
The median income in Fort Belvoir is $104,205.
Fort Belvoir's Overall Cost Of Living
Higher Than The National Average
Cost Of Living In Fort Belvoir Comparison Table
| Living Expense | Fort Belvoir | Virginia | National Average |
|---|---|---|---|
| Overall | 158 | 112 | 100 |
| Services | 99 | 103 | 100 |
| Groceries | 102 | 104 | 100 |
| Health | 289 | 131 | 100 |
| Housing | 99 | 105 | 100 |
| Transportation | 100 | 105 | 100 |
| Utilities | 101 | 104 | 100 |
Source: Cost of living index, normalized to US average = 100
Fort Belvoir, VA Weather
The average high in Fort Belvoir is 67.0° and the average low is 47.2°.
There are 75.2 days of precipitation each year.
Expect an average of 41.2 inches of precipitation each year with 17.4 inches of snow.
| Stat | Fort Belvoir |
|---|---|
| Average Annual High | 67.0 |
| Average Annual Low | 47.2 |
| Annual Precipitation Days | 75.2 |
| Average Annual Precipitation | 41.2 |
| Average Annual Snowfall | 17.4 |
Average High
Days of Rain
Source: NOAA climate normals (30-year)
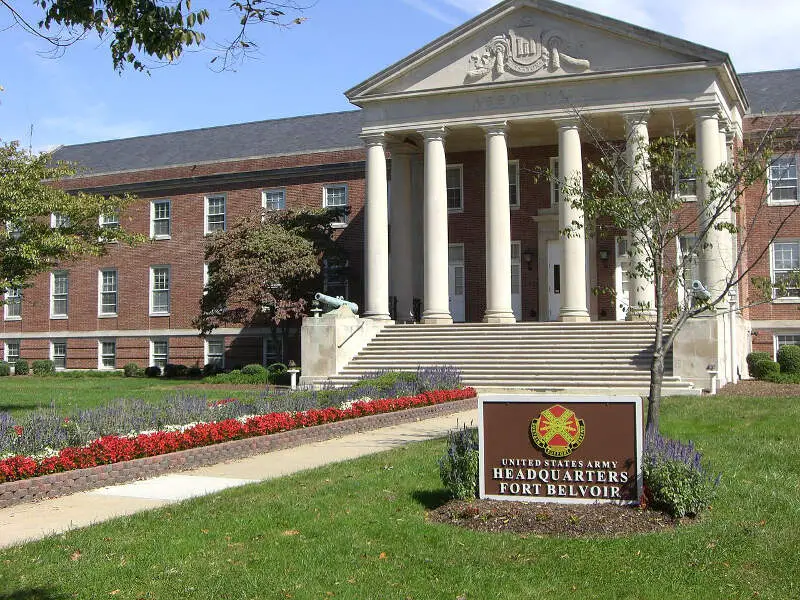
Fort Belvoir, VA Photos
Rankings & Articles For Fort Belvoir


Locations Around Fort Belvoir
Map Of Fort Belvoir, VA
Best Places Around Fort Belvoir
Chevy Chase, MD
Population 9,445
Chevy Chase, MD
Population 9,445
Chevy Chase, MD
Population 9,445
Franklin Farm, VA
Population 18,736
Bethesda, MD
Population 69,397
South Run, VA
Population 6,600
Crosspointe, VA
Population 5,669
Dunn Loring, VA
Population 8,957
Burke, VA
Population 44,029
Kings Park West, VA
Population 13,442
Fort Belvoir Demographics And Statistics
Population over time in Fort Belvoir
The current population in Fort Belvoir is 8,449. The population has increased 34.4% from 2010.
| Year | Population | % Change |
|---|---|---|
| 2024 | 8,449 | 4.2% |
| 2023 | 8,107 | 3.7% |
| 2022 | 7,815 | -0.4% |
| 2021 | 7,850 | 0.7% |
| 2020 | 7,794 | -2.2% |
| 2019 | 7,967 | -1.5% |
| 2018 | 8,091 | 1.0% |
| 2017 | 8,009 | - |
| 2016 | 0 | -100.0% |
| 2015 | 8,209 | 3.4% |
| 2014 | 7,942 | 0.2% |
| 2013 | 7,927 | 4.5% |
| 2012 | 7,588 | 2.9% |
| 2011 | 7,377 | 17.3% |
| 2010 | 6,288 | - |
Race / Ethnicity in Fort Belvoir
See the full breakdown
Fort Belvoir is:
48.1% White with 4,063 White residents.
19.5% African American with 1,646 African American residents.
0.0% American Indian with 0 American Indian residents.
1.6% Asian with 137 Asian residents.
0.8% Hawaiian with 65 Hawaiian residents.
1.2% Other with 102 Other residents.
12.7% Two Or More with 1,072 Two Or More residents.
16.1% Hispanic with 1,364 Hispanic residents.
| Race | Fort Belvoir | VA | USA |
|---|---|---|---|
| White | 48.1% | 58.4% | 57.4% |
| African American | 19.5% | 18.3% | 11.9% |
| American Indian | 0.0% | 0.1% | 0.5% |
| Asian | 1.6% | 6.9% | 5.9% |
| Hawaiian | 0.8% | 0.1% | 0.2% |
| Other | 1.2% | 0.6% | 0.6% |
| Two Or More | 12.7% | 4.7% | 4.3% |
| Hispanic | 16.1% | 11.0% | 19.3% |
Gender in Fort Belvoir
See the full breakdown
Fort Belvoir is 47.1% female with 3,980 female residents.
Fort Belvoir is 52.9% male with 4,468 male residents.
| Gender | Fort Belvoir | VA | USA |
|---|---|---|---|
| Female | 47.1% | 50.6% | 50.5% |
| Male | 52.9% | 49.4% | 49.5% |
Highest level of educational attainment in Fort Belvoir for adults over 25
See the full breakdown
-0.0% of adults in Fort Belvoir completed < 9th grade.
2.0% of adults in Fort Belvoir completed 9-12th grade.
8.0% of adults in Fort Belvoir completed high school / ged.
25.0% of adults in Fort Belvoir completed some college.
10.0% of adults in Fort Belvoir completed associate's degree.
33.0% of adults in Fort Belvoir completed bachelor's degree.
20.0% of adults in Fort Belvoir completed master's degree.
1.0% of adults in Fort Belvoir completed professional degree.
1.0% of adults in Fort Belvoir completed doctorate degree.
| Education | Fort Belvoir | VA | USA |
|---|---|---|---|
| < 9th Grade | -0.0% | 2.0% | 4.0% |
| 9-12th Grade | 2.0% | 5.0% | 6.0% |
| High School / GED | 8.0% | 24.0% | 26.0% |
| Some College | 25.0% | 18.0% | 19.0% |
| Associate's Degree | 10.0% | 8.0% | 9.0% |
| Bachelor's Degree | 33.0% | 24.0% | 22.0% |
| Master's Degree | 20.0% | 14.0% | 10.0% |
| Professional Degree | 1.0% | 3.0% | 2.0% |
| Doctorate Degree | 1.0% | 2.0% | 2.0% |
Household Income For Fort Belvoir, Virginia
See the full breakdown
0.7% of households in Fort Belvoir earn Less than $10,000.
0.0% of households in Fort Belvoir earn $10,000 to $14,999.
0.3% of households in Fort Belvoir earn $15,000 to $24,999.
0.6% of households in Fort Belvoir earn $25,000 to $34,999.
4.1% of households in Fort Belvoir earn $35,000 to $49,999.
22.6% of households in Fort Belvoir earn $50,000 to $74,999.
15.1% of households in Fort Belvoir earn $75,000 to $99,999.
35.4% of households in Fort Belvoir earn $100,000 to $149,999.
16.1% of households in Fort Belvoir earn $150,000 to $199,999.
5.1% of households in Fort Belvoir earn $200,000 or more.
| Income | Fort Belvoir | VA | USA |
|---|---|---|---|
| Less than $10,000 | 0.7% | 4.2% | 5.0% |
| $10,000 to $14,999 | 0.0% | 2.7% | 3.4% |
| $15,000 to $24,999 | 0.3% | 5.2% | 6.3% |
| $25,000 to $34,999 | 0.6% | 5.7% | 6.6% |
| $35,000 to $49,999 | 4.1% | 8.8% | 10.1% |
| $50,000 to $74,999 | 22.6% | 14.3% | 15.5% |
| $75,000 to $99,999 | 15.1% | 12.1% | 12.6% |
| $100,000 to $149,999 | 35.4% | 18.1% | 17.5% |
| $150,000 to $199,999 | 16.1% | 11.1% | 9.6% |
| $200,000 or more | 5.1% | 17.7% | 13.4% |
Source: U.S. Census ACS 5-year estimates (2024)


