Vienna SnackAbility
Overall SnackAbility
Crime in Vienna summary. We use data from the FBI to determine the crime rates in Vienna. Key points include:
There were 148 total crimes in Vienna in the last reporting year.
The overall crime rate per 100,000 people in Vienna is 910.3 / 100k people.
The violent crime rate per 100,000 people in Vienna is 61.5 / 100k people.
The property crime rate per 100,000 people in Vienna is 848.8 / 100k people.
Overall, crime in Vienna is -57.04% below the national average.
Total Crimes
Below National Average
Crime In Vienna Comparison Table
| Statistic | Count Raw |
Vienna / 100k People |
Virginia / 100k People |
National / 100k People |
|---|---|---|---|---|
| Total Crimes Per 100K | 148 | 910.3 | 1,787.6 | 2,119.2 |
| Violent Crime | 10 | 61.5 | 217.9 | 359.0 |
| Murder | 0 | 0.0 | 4.8 | 5.0 |
| Robbery | 2 | 12.3 | 33.1 | 61.0 |
| Aggravated Assault | 7 | 43.1 | 152.2 | 256.0 |
| Property Crime | 138 | 848.8 | 1,569.7 | 1,760.0 |
| Burglary | 8 | 49.2 | 108.7 | 229.0 |
| Larceny | 125 | 768.9 | 1,315.9 | 1,272.0 |
| Car Theft | 5 | 30.8 | 145.1 | 259.0 |
Source: FBI Uniform Crime Reporting (2024)
Cost of living in Vienna summary. We use data on the cost of living to determine how expensive it is to live in Vienna. Real estate prices drive most of the variance in cost of living around Virginia. Key points include:
The cost of living in Vienna is 183 with 100 being average.
The cost of living in Vienna is 1.8x higher than the national average.
The median home value in Vienna is $1,179,672.
The median income in Vienna is $216,953.
Vienna's Overall Cost Of Living
Higher Than The National Average
Cost Of Living In Vienna Comparison Table
| Living Expense | Vienna | Virginia | National Average |
|---|---|---|---|
| Overall | 183 | 112 | 100 |
| Services | 102 | 103 | 100 |
| Groceries | 99 | 104 | 100 |
| Health | 366 | 131 | 100 |
| Housing | 104 | 105 | 100 |
| Transportation | 105 | 105 | 100 |
| Utilities | 108 | 104 | 100 |
Source: Cost of living index, normalized to US average = 100
Vienna, VA Weather
The average high in Vienna is 65.7° and the average low is 45.3°.
There are 77.0 days of precipitation each year.
Expect an average of 42.6 inches of precipitation each year with 20.8 inches of snow.
| Stat | Vienna |
|---|---|
| Average Annual High | 65.7 |
| Average Annual Low | 45.3 |
| Annual Precipitation Days | 77.0 |
| Average Annual Precipitation | 42.6 |
| Average Annual Snowfall | 20.8 |
Average High
Days of Rain
Source: NOAA climate normals (30-year)
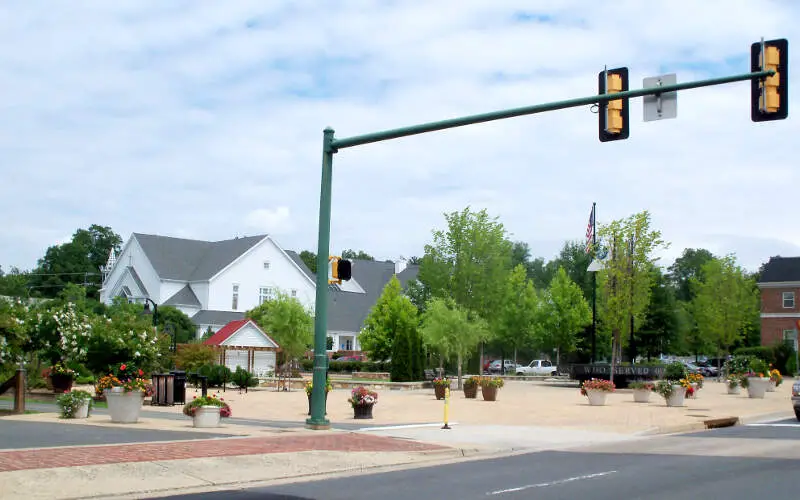
Vienna, VA Photos
1 Reviews & Comments About Vienna

I have lived all over the country from the mid-west to up and down the coats and Vienna, VA has been our favorite place. Vienna is a Wonderful area where there is a bit of everything. Great place to raise kids in a small town environment while being just 20 minutes away from the nation's capital. Access to everything while being far away from the big city inconveniences that we all forget about.
It's a close knit community where neighbors know each other and take pride in their town. The community is involved in a lot of activity planning and involved deeply in keeping the town beautiful.
Rankings & Articles For Vienna


Locations Around Vienna
Map Of Vienna, VA
Best Places Around Vienna
Four Corners, MD
Population 8,150
North Potomac, MD
Population 23,922
Layhill, MD
Population 5,497
South Kensington, MD
Population 8,148
Colesville, MD
Population 14,519
Olney, MD
Population 35,797
Kemp Mill, MD
Population 13,042
Travilah, MD
Population 11,721
Chevy Chase, MD
Population 9,445
Vienna Demographics And Statistics
Population over time in Vienna
The current population in Vienna is 16,412. The population has increased 6.7% from 2010.
| Year | Population | % Change |
|---|---|---|
| 2024 | 16,412 | 0.3% |
| 2023 | 16,369 | -0.2% |
| 2022 | 16,401 | -0.4% |
| 2021 | 16,465 | -0.4% |
| 2020 | 16,532 | 0.3% |
| 2019 | 16,489 | 0.0% |
| 2018 | 16,488 | 0.1% |
| 2017 | 16,474 | 0.6% |
| 2016 | 16,378 | 0.2% |
| 2015 | 16,341 | 1.0% |
| 2014 | 16,173 | 1.3% |
| 2013 | 15,958 | 1.3% |
| 2012 | 15,748 | 1.2% |
| 2011 | 15,564 | 1.2% |
| 2010 | 15,387 | - |
Race / Ethnicity in Vienna
See the full breakdown
Vienna is:
64.7% White with 10,623 White residents.
4.5% African American with 733 African American residents.
0.0% American Indian with 7 American Indian residents.
14.1% Asian with 2,315 Asian residents.
0.0% Hawaiian with 0 Hawaiian residents.
1.0% Other with 172 Other residents.
7.1% Two Or More with 1,171 Two Or More residents.
8.5% Hispanic with 1,391 Hispanic residents.
| Race | Vienna | VA | USA |
|---|---|---|---|
| White | 64.7% | 58.4% | 57.4% |
| African American | 4.5% | 18.3% | 11.9% |
| American Indian | 0.0% | 0.1% | 0.5% |
| Asian | 14.1% | 6.9% | 5.9% |
| Hawaiian | 0.0% | 0.1% | 0.2% |
| Other | 1.0% | 0.6% | 0.6% |
| Two Or More | 7.1% | 4.7% | 4.3% |
| Hispanic | 8.5% | 11.0% | 19.3% |
Gender in Vienna
See the full breakdown
Vienna is 49.5% female with 8,125 female residents.
Vienna is 50.5% male with 8,287 male residents.
| Gender | Vienna | VA | USA |
|---|---|---|---|
| Female | 49.5% | 50.6% | 50.5% |
| Male | 50.5% | 49.4% | 49.5% |
Highest level of educational attainment in Vienna for adults over 25
See the full breakdown
3.0% of adults in Vienna completed < 9th grade.
1.0% of adults in Vienna completed 9-12th grade.
9.0% of adults in Vienna completed high school / ged.
9.0% of adults in Vienna completed some college.
3.0% of adults in Vienna completed associate's degree.
32.0% of adults in Vienna completed bachelor's degree.
31.0% of adults in Vienna completed master's degree.
8.0% of adults in Vienna completed professional degree.
4.0% of adults in Vienna completed doctorate degree.
| Education | Vienna | VA | USA |
|---|---|---|---|
| < 9th Grade | 3.0% | 2.0% | 4.0% |
| 9-12th Grade | 1.0% | 5.0% | 6.0% |
| High School / GED | 9.0% | 24.0% | 26.0% |
| Some College | 9.0% | 18.0% | 19.0% |
| Associate's Degree | 3.0% | 8.0% | 9.0% |
| Bachelor's Degree | 32.0% | 24.0% | 22.0% |
| Master's Degree | 31.0% | 14.0% | 10.0% |
| Professional Degree | 8.0% | 3.0% | 2.0% |
| Doctorate Degree | 4.0% | 2.0% | 2.0% |
Household Income For Vienna, Virginia
See the full breakdown
2.2% of households in Vienna earn Less than $10,000.
0.9% of households in Vienna earn $10,000 to $14,999.
2.8% of households in Vienna earn $15,000 to $24,999.
2.0% of households in Vienna earn $25,000 to $34,999.
5.3% of households in Vienna earn $35,000 to $49,999.
4.4% of households in Vienna earn $50,000 to $74,999.
3.8% of households in Vienna earn $75,000 to $99,999.
13.7% of households in Vienna earn $100,000 to $149,999.
11.9% of households in Vienna earn $150,000 to $199,999.
53.1% of households in Vienna earn $200,000 or more.
| Income | Vienna | VA | USA |
|---|---|---|---|
| Less than $10,000 | 2.2% | 4.2% | 5.0% |
| $10,000 to $14,999 | 0.9% | 2.7% | 3.4% |
| $15,000 to $24,999 | 2.8% | 5.2% | 6.3% |
| $25,000 to $34,999 | 2.0% | 5.7% | 6.6% |
| $35,000 to $49,999 | 5.3% | 8.8% | 10.1% |
| $50,000 to $74,999 | 4.4% | 14.3% | 15.5% |
| $75,000 to $99,999 | 3.8% | 12.1% | 12.6% |
| $100,000 to $149,999 | 13.7% | 18.1% | 17.5% |
| $150,000 to $199,999 | 11.9% | 11.1% | 9.6% |
| $200,000 or more | 53.1% | 17.7% | 13.4% |
Source: U.S. Census ACS 5-year estimates (2024)


