Warrenton SnackAbility
Overall SnackAbility
Crime in Warrenton summary. We use data from the FBI to determine the crime rates in Warrenton. Key points include:
There were 142 total crimes in Warrenton in the last reporting year.
The overall crime rate per 100,000 people in Warrenton is 1,383.3 / 100k people.
The violent crime rate per 100,000 people in Warrenton is 97.4 / 100k people.
The property crime rate per 100,000 people in Warrenton is 1,285.9 / 100k people.
Overall, crime in Warrenton is -34.72% below the national average.
Total Crimes
Below National Average
Crime In Warrenton Comparison Table
| Statistic | Count Raw |
Warrenton / 100k People |
Virginia / 100k People |
National / 100k People |
|---|---|---|---|---|
| Total Crimes Per 100K | 142 | 1,383.3 | 1,787.6 | 2,119.2 |
| Violent Crime | 10 | 97.4 | 217.9 | 359.0 |
| Murder | 0 | 0.0 | 4.8 | 5.0 |
| Robbery | 3 | 29.2 | 33.1 | 61.0 |
| Aggravated Assault | 7 | 68.2 | 152.2 | 256.0 |
| Property Crime | 132 | 1,285.9 | 1,569.7 | 1,760.0 |
| Burglary | 2 | 19.5 | 108.7 | 229.0 |
| Larceny | 123 | 1,198.2 | 1,315.9 | 1,272.0 |
| Car Theft | 7 | 68.2 | 145.1 | 259.0 |
Source: FBI Uniform Crime Reporting (2024)
Cost of living in Warrenton summary. We use data on the cost of living to determine how expensive it is to live in Warrenton. Real estate prices drive most of the variance in cost of living around Virginia. Key points include:
The cost of living in Warrenton is 128 with 100 being average.
The cost of living in Warrenton is 1.3x higher than the national average.
The median home value in Warrenton is $681,948.
The median income in Warrenton is $83,331.
Warrenton's Overall Cost Of Living
Higher Than The National Average
Cost Of Living In Warrenton Comparison Table
| Living Expense | Warrenton | Virginia | National Average |
|---|---|---|---|
| Overall | 128 | 112 | 100 |
| Services | 105 | 103 | 100 |
| Groceries | 105 | 104 | 100 |
| Health | 178 | 131 | 100 |
| Housing | 107 | 105 | 100 |
| Transportation | 107 | 105 | 100 |
| Utilities | 103 | 104 | 100 |
Source: Cost of living index, normalized to US average = 100
Warrenton, VA Weather
The average high in Warrenton is 65.9° and the average low is 43.7°.
There are 72.6 days of precipitation each year.
Expect an average of 42.3 inches of precipitation each year with 17.9 inches of snow.
| Stat | Warrenton |
|---|---|
| Average Annual High | 65.9 |
| Average Annual Low | 43.7 |
| Annual Precipitation Days | 72.6 |
| Average Annual Precipitation | 42.3 |
| Average Annual Snowfall | 17.9 |
Average High
Days of Rain
Source: NOAA climate normals (30-year)
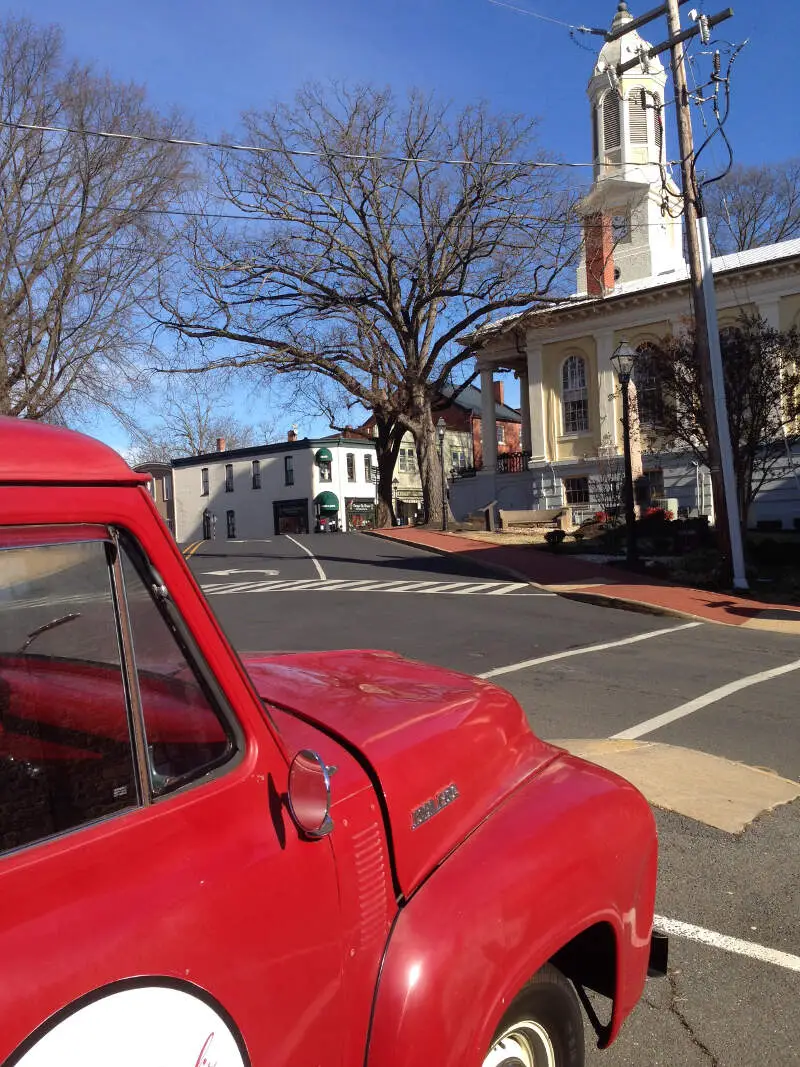
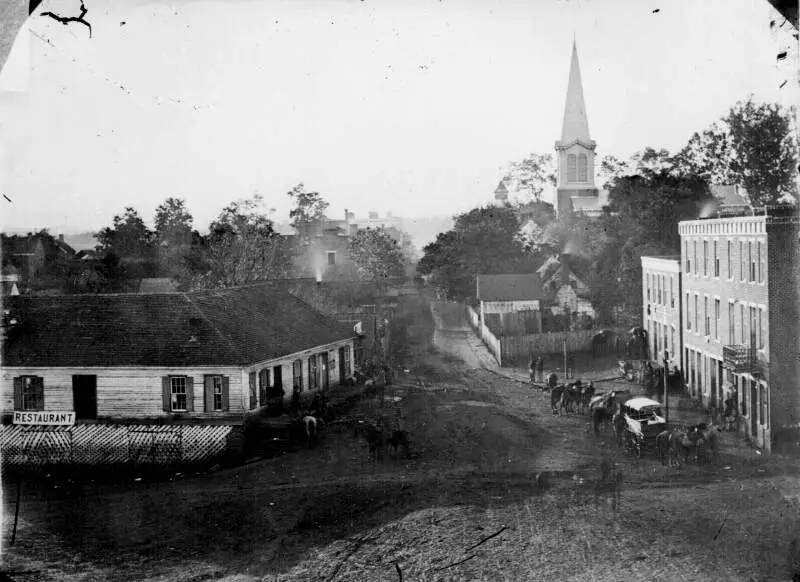
Warrenton, VA Photos
Rankings & Articles For Warrenton


Locations Around Warrenton
Map Of Warrenton, VA
Best Places Around Warrenton
Stone Ridge, VA
Population 16,603
New Baltimore, VA
Population 11,919
Manassas Park, VA
Population 16,798
Linton Hall, VA
Population 41,876
Buckhall, VA
Population 21,602
Gainesville, VA
Population 18,196
Manassas, VA
Population 42,976
Sudley, VA
Population 19,162
Yorkshire, VA
Population 9,782
Warrenton Demographics And Statistics
Population over time in Warrenton
The current population in Warrenton is 10,176. The population has increased 10.1% from 2010.
| Year | Population | % Change |
|---|---|---|
| 2024 | 10,176 | 0.2% |
| 2023 | 10,151 | 0.4% |
| 2022 | 10,111 | 1.1% |
| 2021 | 10,002 | 0.7% |
| 2020 | 9,928 | 0.2% |
| 2019 | 9,913 | 0.4% |
| 2018 | 9,873 | 0.2% |
| 2017 | 9,854 | -0.3% |
| 2016 | 9,880 | 0.4% |
| 2015 | 9,843 | 0.7% |
| 2014 | 9,774 | 0.9% |
| 2013 | 9,690 | 1.2% |
| 2012 | 9,571 | 1.6% |
| 2011 | 9,417 | 1.9% |
| 2010 | 9,245 | - |
Race / Ethnicity in Warrenton
See the full breakdown
Warrenton is:
70.8% White with 7,205 White residents.
9.9% African American with 1,007 African American residents.
0.1% American Indian with 10 American Indian residents.
2.7% Asian with 274 Asian residents.
0.0% Hawaiian with 0 Hawaiian residents.
0.4% Other with 36 Other residents.
6.5% Two Or More with 658 Two Or More residents.
9.7% Hispanic with 986 Hispanic residents.
| Race | Warrenton | VA | USA |
|---|---|---|---|
| White | 70.8% | 58.4% | 57.4% |
| African American | 9.9% | 18.3% | 11.9% |
| American Indian | 0.1% | 0.1% | 0.5% |
| Asian | 2.7% | 6.9% | 5.9% |
| Hawaiian | 0.0% | 0.1% | 0.2% |
| Other | 0.4% | 0.6% | 0.6% |
| Two Or More | 6.5% | 4.7% | 4.3% |
| Hispanic | 9.7% | 11.0% | 19.3% |
Gender in Warrenton
See the full breakdown
Warrenton is 55.0% female with 5,596 female residents.
Warrenton is 45.0% male with 4,580 male residents.
| Gender | Warrenton | VA | USA |
|---|---|---|---|
| Female | 55.0% | 50.6% | 50.5% |
| Male | 45.0% | 49.4% | 49.5% |
Highest level of educational attainment in Warrenton for adults over 25
See the full breakdown
4.0% of adults in Warrenton completed < 9th grade.
5.0% of adults in Warrenton completed 9-12th grade.
20.0% of adults in Warrenton completed high school / ged.
19.0% of adults in Warrenton completed some college.
6.0% of adults in Warrenton completed associate's degree.
29.0% of adults in Warrenton completed bachelor's degree.
15.0% of adults in Warrenton completed master's degree.
1.0% of adults in Warrenton completed professional degree.
1.0% of adults in Warrenton completed doctorate degree.
| Education | Warrenton | VA | USA |
|---|---|---|---|
| < 9th Grade | 4.0% | 2.0% | 4.0% |
| 9-12th Grade | 5.0% | 5.0% | 6.0% |
| High School / GED | 20.0% | 24.0% | 26.0% |
| Some College | 19.0% | 18.0% | 19.0% |
| Associate's Degree | 6.0% | 8.0% | 9.0% |
| Bachelor's Degree | 29.0% | 24.0% | 22.0% |
| Master's Degree | 15.0% | 14.0% | 10.0% |
| Professional Degree | 1.0% | 3.0% | 2.0% |
| Doctorate Degree | 1.0% | 2.0% | 2.0% |
Household Income For Warrenton, Virginia
See the full breakdown
2.4% of households in Warrenton earn Less than $10,000.
3.4% of households in Warrenton earn $10,000 to $14,999.
3.4% of households in Warrenton earn $15,000 to $24,999.
6.5% of households in Warrenton earn $25,000 to $34,999.
10.9% of households in Warrenton earn $35,000 to $49,999.
17.9% of households in Warrenton earn $50,000 to $74,999.
15.8% of households in Warrenton earn $75,000 to $99,999.
14.9% of households in Warrenton earn $100,000 to $149,999.
11.1% of households in Warrenton earn $150,000 to $199,999.
13.7% of households in Warrenton earn $200,000 or more.
| Income | Warrenton | VA | USA |
|---|---|---|---|
| Less than $10,000 | 2.4% | 4.2% | 5.0% |
| $10,000 to $14,999 | 3.4% | 2.7% | 3.4% |
| $15,000 to $24,999 | 3.4% | 5.2% | 6.3% |
| $25,000 to $34,999 | 6.5% | 5.7% | 6.6% |
| $35,000 to $49,999 | 10.9% | 8.8% | 10.1% |
| $50,000 to $74,999 | 17.9% | 14.3% | 15.5% |
| $75,000 to $99,999 | 15.8% | 12.1% | 12.6% |
| $100,000 to $149,999 | 14.9% | 18.1% | 17.5% |
| $150,000 to $199,999 | 11.1% | 11.1% | 9.6% |
| $200,000 or more | 13.7% | 17.7% | 13.4% |
Source: U.S. Census ACS 5-year estimates (2024)


