Bremerton SnackAbility
Overall SnackAbility
Crime in Bremerton summary. We use data from the FBI to determine the crime rates in Bremerton. Key points include:
There were 1,497 total crimes in Bremerton in the last reporting year.
The overall crime rate per 100,000 people in Bremerton is 3,248.8 / 100k people.
The violent crime rate per 100,000 people in Bremerton is 434.0 / 100k people.
The property crime rate per 100,000 people in Bremerton is 2,814.7 / 100k people.
Overall, crime in Bremerton is 53.30% above the national average.
Total Crimes
Above National Average
Crime In Bremerton Comparison Table
| Statistic | Count Raw |
Bremerton / 100k People |
Washington / 100k People |
National / 100k People |
|---|---|---|---|---|
| Total Crimes Per 100K | 1,497 | 3,248.8 | 2,792.6 | 2,119.2 |
| Violent Crime | 200 | 434.0 | 326.1 | 359.0 |
| Murder | 2 | 4.3 | 3.8 | 5.0 |
| Robbery | 22 | 47.7 | 67.5 | 61.0 |
| Aggravated Assault | 127 | 275.6 | 217.0 | 256.0 |
| Property Crime | 1,297 | 2,814.7 | 2,466.5 | 1,760.0 |
| Burglary | 230 | 499.1 | 398.8 | 229.0 |
| Larceny | 890 | 1,931.5 | 1,634.2 | 1,272.0 |
| Car Theft | 177 | 384.1 | 433.5 | 259.0 |
Source: FBI Uniform Crime Reporting (2024)
Cost of living in Bremerton summary. We use data on the cost of living to determine how expensive it is to live in Bremerton. Real estate prices drive most of the variance in cost of living around Washington. Key points include:
The cost of living in Bremerton is 120 with 100 being average.
The cost of living in Bremerton is 1.2x higher than the national average.
The median home value in Bremerton is $483,131.
The median income in Bremerton is $74,940.
Bremerton's Overall Cost Of Living
Higher Than The National Average
Cost Of Living In Bremerton Comparison Table
| Living Expense | Bremerton | Washington | National Average |
|---|---|---|---|
| Overall | 120 | 120 | 100 |
| Services | 110 | 108 | 100 |
| Groceries | 108 | 108 | 100 |
| Health | 143 | 137 | 100 |
| Housing | 112 | 111 | 100 |
| Transportation | 109 | 111 | 100 |
| Utilities | 108 | 110 | 100 |
Source: Cost of living index, normalized to US average = 100
Bremerton, WA Weather
The average high in Bremerton is 60.0° and the average low is 43.7°.
There are 102.3 days of precipitation each year.
Expect an average of 51.4 inches of precipitation each year with 3.1 inches of snow.
| Stat | Bremerton |
|---|---|
| Average Annual High | 60.0 |
| Average Annual Low | 43.7 |
| Annual Precipitation Days | 102.3 |
| Average Annual Precipitation | 51.4 |
| Average Annual Snowfall | 3.1 |
Average High
Days of Rain
Source: NOAA climate normals (30-year)
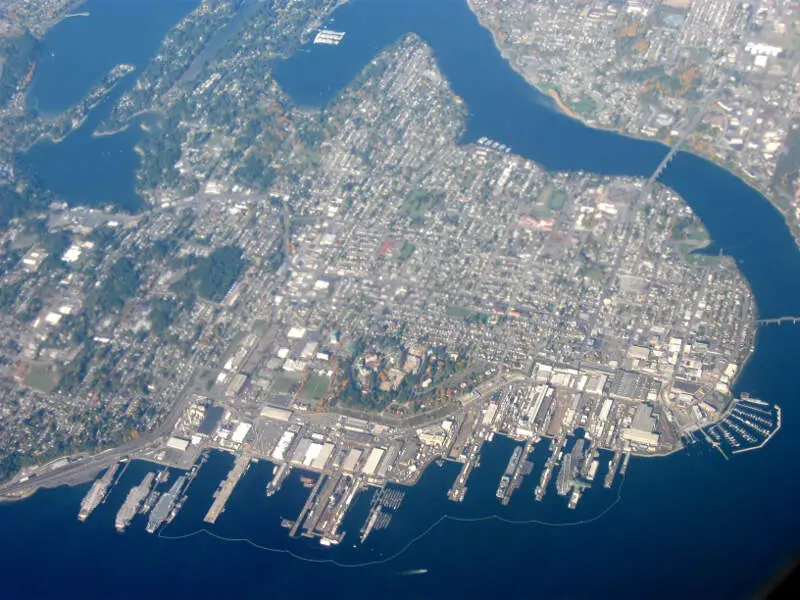
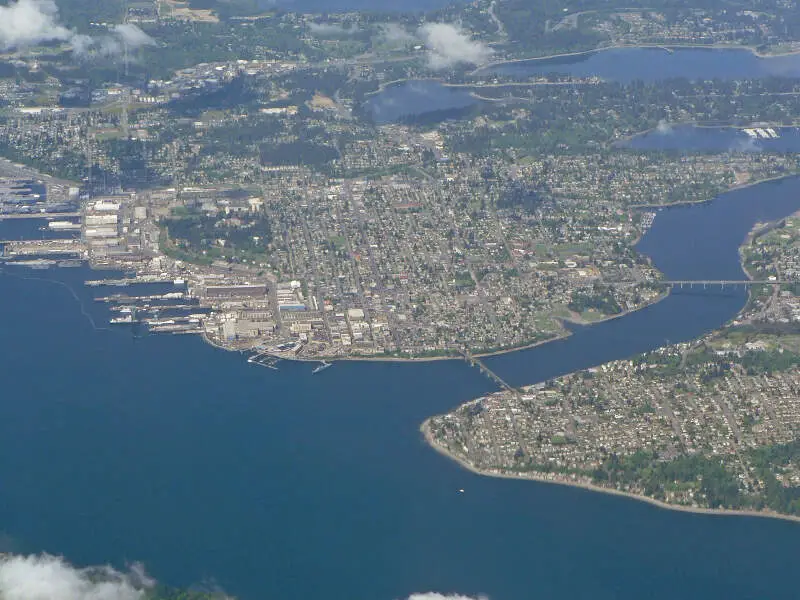
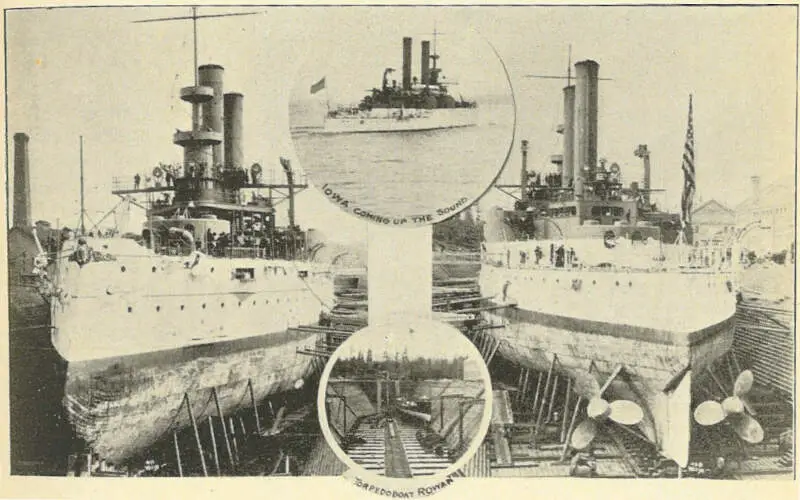
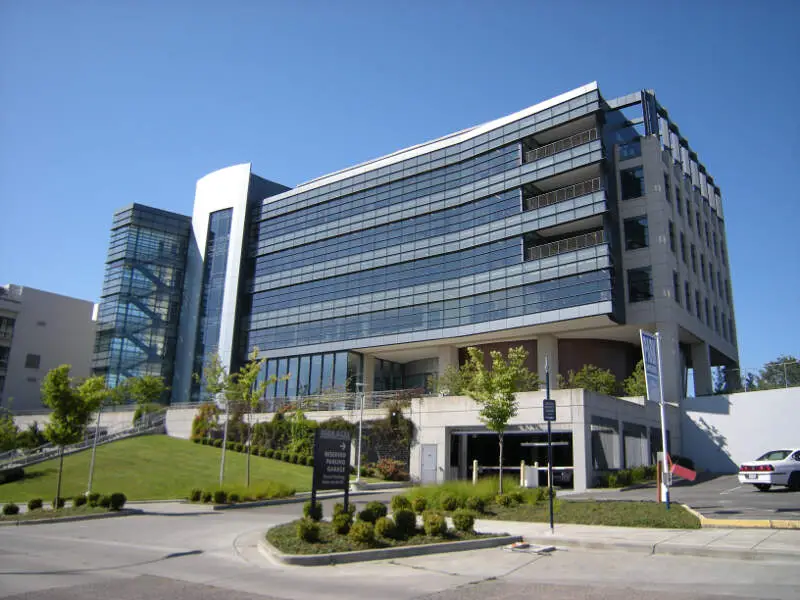
Bremerton, WA Photos

2 Reviews & Comments About Bremerton

We just moved to Bremerton about a year ago and absolutely love it!
There are gorgeous family friendly refurbished parks, the downtown has already had the sidewalks widened, more streets are becoming pedestrian friendly, and there are beautiful homes that are very affordable when compared to King County and Tacoma.
I will admit, I would like to see more little shops and restaurants fill the storefronts, but it's only a matter of time. I think that Bremerton gets a bad rap for how it looked a decade ago, but it is lovely now and getting better every month.
I agree with you I have lived in Bremerton for about 18 years, I love it..I agree we need to have more business here but too you have to remember we are a navy town so people come and go causing our economy to change alot..
Rankings & Articles For Bremerton


Locations Around Bremerton
Map Of Bremerton, WA
Best Places Around Bremerton
Gig Harbor, WA
Population 12,424
Port Orchard, WA
Population 17,149
Wollochet, WA
Population 6,689
Bangor Base, WA
Population 6,112
Bainbridge Island, WA
Population 24,631
Poulsbo, WA
Population 12,165
Artondale, WA
Population 14,073
Vashon, WA
Population 9,934
Silverdale, WA
Population 20,685
Parkwood, WA
Population 6,873
Bremerton Demographics And Statistics
Population over time in Bremerton
The current population in Bremerton is 44,830. The population has increased 18.9% from 2010.
| Year | Population | % Change |
|---|---|---|
| 2024 | 44,830 | 0.7% |
| 2023 | 44,531 | 1.2% |
| 2022 | 43,983 | 1.5% |
| 2021 | 43,345 | 5.1% |
| 2020 | 41,258 | 1.5% |
| 2019 | 40,631 | 1.0% |
| 2018 | 40,220 | 1.6% |
| 2017 | 39,584 | 0.5% |
| 2016 | 39,388 | 1.0% |
| 2015 | 39,017 | 0.9% |
| 2014 | 38,664 | 0.1% |
| 2013 | 38,614 | 0.8% |
| 2012 | 38,311 | 1.0% |
| 2011 | 37,933 | 0.6% |
| 2010 | 37,689 | - |
Race / Ethnicity in Bremerton
See the full breakdown
Bremerton is:
63.0% White with 28,264 White residents.
3.1% African American with 1,399 African American residents.
0.9% American Indian with 404 American Indian residents.
6.3% Asian with 2,841 Asian residents.
1.8% Hawaiian with 827 Hawaiian residents.
0.6% Other with 278 Other residents.
10.9% Two Or More with 4,874 Two Or More residents.
13.3% Hispanic with 5,943 Hispanic residents.
| Race | Bremerton | WA | USA |
|---|---|---|---|
| White | 63.0% | 63.1% | 57.4% |
| African American | 3.1% | 3.8% | 11.9% |
| American Indian | 0.9% | 0.8% | 0.5% |
| Asian | 6.3% | 9.7% | 5.9% |
| Hawaiian | 1.8% | 0.7% | 0.2% |
| Other | 0.6% | 0.6% | 0.6% |
| Two Or More | 10.9% | 6.8% | 4.3% |
| Hispanic | 13.3% | 14.4% | 19.3% |
Gender in Bremerton
See the full breakdown
Bremerton is 47.1% female with 21,106 female residents.
Bremerton is 52.9% male with 23,724 male residents.
| Gender | Bremerton | WA | USA |
|---|---|---|---|
| Female | 47.1% | 49.6% | 50.5% |
| Male | 52.9% | 50.4% | 49.5% |
Highest level of educational attainment in Bremerton for adults over 25
See the full breakdown
1.0% of adults in Bremerton completed < 9th grade.
4.0% of adults in Bremerton completed 9-12th grade.
24.0% of adults in Bremerton completed high school / ged.
29.0% of adults in Bremerton completed some college.
13.0% of adults in Bremerton completed associate's degree.
19.0% of adults in Bremerton completed bachelor's degree.
8.0% of adults in Bremerton completed master's degree.
1.0% of adults in Bremerton completed professional degree.
1.0% of adults in Bremerton completed doctorate degree.
| Education | Bremerton | WA | USA |
|---|---|---|---|
| < 9th Grade | 1.0% | 4.0% | 4.0% |
| 9-12th Grade | 4.0% | 4.0% | 6.0% |
| High School / GED | 24.0% | 22.0% | 26.0% |
| Some College | 29.0% | 21.0% | 19.0% |
| Associate's Degree | 13.0% | 10.0% | 9.0% |
| Bachelor's Degree | 19.0% | 24.0% | 22.0% |
| Master's Degree | 8.0% | 11.0% | 10.0% |
| Professional Degree | 1.0% | 2.0% | 2.0% |
| Doctorate Degree | 1.0% | 2.0% | 2.0% |
Household Income For Bremerton, Washington
See the full breakdown
5.6% of households in Bremerton earn Less than $10,000.
4.4% of households in Bremerton earn $10,000 to $14,999.
5.2% of households in Bremerton earn $15,000 to $24,999.
6.2% of households in Bremerton earn $25,000 to $34,999.
9.8% of households in Bremerton earn $35,000 to $49,999.
19.0% of households in Bremerton earn $50,000 to $74,999.
14.5% of households in Bremerton earn $75,000 to $99,999.
17.6% of households in Bremerton earn $100,000 to $149,999.
10.3% of households in Bremerton earn $150,000 to $199,999.
7.5% of households in Bremerton earn $200,000 or more.
| Income | Bremerton | WA | USA |
|---|---|---|---|
| Less than $10,000 | 5.6% | 3.9% | 5.0% |
| $10,000 to $14,999 | 4.4% | 2.5% | 3.4% |
| $15,000 to $24,999 | 5.2% | 4.6% | 6.3% |
| $25,000 to $34,999 | 6.2% | 5.0% | 6.6% |
| $35,000 to $49,999 | 9.8% | 8.2% | 10.1% |
| $50,000 to $74,999 | 19.0% | 14.1% | 15.5% |
| $75,000 to $99,999 | 14.5% | 12.4% | 12.6% |
| $100,000 to $149,999 | 17.6% | 19.2% | 17.5% |
| $150,000 to $199,999 | 10.3% | 11.4% | 9.6% |
| $200,000 or more | 7.5% | 18.5% | 13.4% |
Source: U.S. Census ACS 5-year estimates (2024)


