Port Orchard SnackAbility
Overall SnackAbility
Crime in Port Orchard summary. We use data from the FBI to determine the crime rates in Port Orchard. Key points include:
There were 618 total crimes in Port Orchard in the last reporting year.
The overall crime rate per 100,000 people in Port Orchard is 3,286.2 / 100k people.
The violent crime rate per 100,000 people in Port Orchard is 388.2 / 100k people.
The property crime rate per 100,000 people in Port Orchard is 2,898.0 / 100k people.
Overall, crime in Port Orchard is 55.06% above the national average.
Total Crimes
Above National Average
Crime In Port Orchard Comparison Table
| Statistic | Count Raw |
Port Orchard / 100k People |
Washington / 100k People |
National / 100k People |
|---|---|---|---|---|
| Total Crimes Per 100K | 618 | 3,286.2 | 2,792.6 | 2,119.2 |
| Violent Crime | 73 | 388.2 | 326.1 | 359.0 |
| Murder | 0 | 0.0 | 3.8 | 5.0 |
| Robbery | 8 | 42.5 | 67.5 | 61.0 |
| Aggravated Assault | 50 | 265.9 | 217.0 | 256.0 |
| Property Crime | 545 | 2,898.0 | 2,466.5 | 1,760.0 |
| Burglary | 84 | 446.7 | 398.8 | 229.0 |
| Larceny | 409 | 2,174.8 | 1,634.2 | 1,272.0 |
| Car Theft | 52 | 276.5 | 433.5 | 259.0 |
Source: FBI Uniform Crime Reporting (2024)
Cost of living in Port Orchard summary. We use data on the cost of living to determine how expensive it is to live in Port Orchard. Real estate prices drive most of the variance in cost of living around Washington. Key points include:
The cost of living in Port Orchard is 131 with 100 being average.
The cost of living in Port Orchard is 1.3x higher than the national average.
The median home value in Port Orchard is $556,427.
The median income in Port Orchard is $89,795.
Port Orchard's Overall Cost Of Living
Higher Than The National Average
Cost Of Living In Port Orchard Comparison Table
| Living Expense | Port Orchard | Washington | National Average |
|---|---|---|---|
| Overall | 131 | 120 | 100 |
| Services | 107 | 108 | 100 |
| Groceries | 108 | 108 | 100 |
| Health | 183 | 137 | 100 |
| Housing | 110 | 111 | 100 |
| Transportation | 109 | 111 | 100 |
| Utilities | 107 | 110 | 100 |
Source: Cost of living index, normalized to US average = 100
Port Orchard, WA Weather
The average high in Port Orchard is 59.5° and the average low is 43.3°.
There are 100.4 days of precipitation each year.
Expect an average of 50.6 inches of precipitation each year with 3.3 inches of snow.
| Stat | Port Orchard |
|---|---|
| Average Annual High | 59.5 |
| Average Annual Low | 43.3 |
| Annual Precipitation Days | 100.4 |
| Average Annual Precipitation | 50.6 |
| Average Annual Snowfall | 3.3 |
Average High
Days of Rain
Source: NOAA climate normals (30-year)
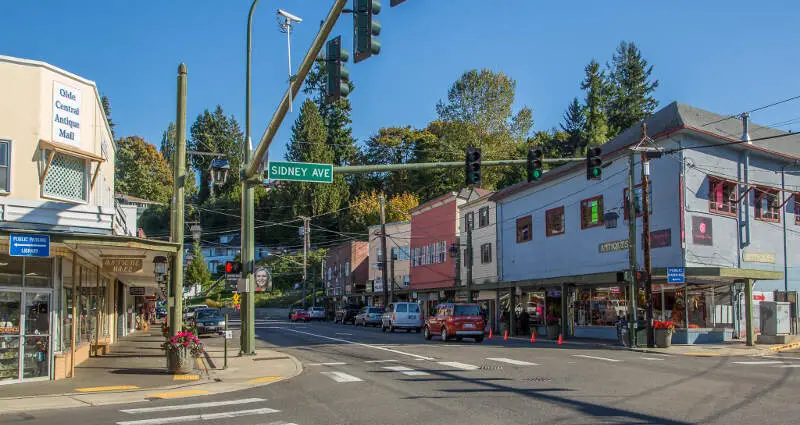
Port Orchard, WA Photos

1 Reviews & Comments About Port Orchard

Port Orchard has a wonderful school system, with teachers and mentors who care deeply about their students. The town itself is backed on two sides by water with wooded areas encompassing the other two sides. Despite having all of the features of a picturesque small town it is rampant with theft stemming from a county wide M**h problem. The local police force is mostly made up of wonderful individuals, but due to the amount of crime they experience daily they care very little about crime, including property damage. In one neighborhood a man tore up four cars and two yards including fencing, and despite being given the name, address, and vehicle of the person who did it, the police never followed up. One officer in particular there also goes out of his way to stalk and hurt people, with little recourse. He was convinced that I was not a twin because of the way the state places twins with similar names into the system. I was unable to drive because he threatened to arrest me for using false identification, going as far as to call my military veteran father to inform him that his son had two identities. Until City Hall received a notice of my intent to sue the city, no one attempted to resolve this incident.
Great local shops downtown with easy ferry 15 minute Ferry access to Bremerton and Seattle.
Most citizens are small town minded, and very friendly.
Fantastic teaching and schooling system.
McCormick Woods Golf Course has great food and reasonable green prices.
Do not leave any valuables whatsoever in your car. If you drive an older car park as close to the entrance and cameras as possible.
Do not park anywhere overnight unless you are at a hotel.
Local police that are not the Sheriffs office treat everyone with little respect.
Rankings & Articles For Port Orchard


Locations Around Port Orchard
Map Of Port Orchard, WA
Best Places Around Port Orchard
Gig Harbor, WA
Population 12,424
Bremerton, WA
Population 44,830
Wollochet, WA
Population 6,689
Bangor Base, WA
Population 6,112
Bainbridge Island, WA
Population 24,631
Poulsbo, WA
Population 12,165
Artondale, WA
Population 14,073
Vashon, WA
Population 9,934
SeaTac, WA
Population 32,414
Silverdale, WA
Population 20,685
Port Orchard Demographics And Statistics
Population over time in Port Orchard
The current population in Port Orchard is 17,149. The population has increased 59.8% from 2010.
| Year | Population | % Change |
|---|---|---|
| 2024 | 17,149 | 4.6% |
| 2023 | 16,398 | 3.7% |
| 2022 | 15,820 | 3.3% |
| 2021 | 15,315 | 7.1% |
| 2020 | 14,303 | 1.7% |
| 2019 | 14,062 | 2.0% |
| 2018 | 13,788 | 2.3% |
| 2017 | 13,476 | 1.6% |
| 2016 | 13,265 | 2.0% |
| 2015 | 13,004 | 2.3% |
| 2014 | 12,715 | 3.7% |
| 2013 | 12,260 | 9.1% |
| 2012 | 11,239 | 2.6% |
| 2011 | 10,949 | 2.0% |
| 2010 | 10,734 | - |
Race / Ethnicity in Port Orchard
See the full breakdown
Port Orchard is:
73.5% White with 12,600 White residents.
1.3% African American with 220 African American residents.
0.3% American Indian with 50 American Indian residents.
4.9% Asian with 841 Asian residents.
1.7% Hawaiian with 285 Hawaiian residents.
0.3% Other with 59 Other residents.
7.4% Two Or More with 1,272 Two Or More residents.
10.6% Hispanic with 1,822 Hispanic residents.
| Race | Port Orchard | WA | USA |
|---|---|---|---|
| White | 73.5% | 63.1% | 57.4% |
| African American | 1.3% | 3.8% | 11.9% |
| American Indian | 0.3% | 0.8% | 0.5% |
| Asian | 4.9% | 9.7% | 5.9% |
| Hawaiian | 1.7% | 0.7% | 0.2% |
| Other | 0.3% | 0.6% | 0.6% |
| Two Or More | 7.4% | 6.8% | 4.3% |
| Hispanic | 10.6% | 14.4% | 19.3% |
Gender in Port Orchard
See the full breakdown
Port Orchard is 47.4% female with 8,132 female residents.
Port Orchard is 52.6% male with 9,017 male residents.
| Gender | Port Orchard | WA | USA |
|---|---|---|---|
| Female | 47.4% | 49.6% | 50.5% |
| Male | 52.6% | 50.4% | 49.5% |
Highest level of educational attainment in Port Orchard for adults over 25
See the full breakdown
3.0% of adults in Port Orchard completed < 9th grade.
3.0% of adults in Port Orchard completed 9-12th grade.
22.0% of adults in Port Orchard completed high school / ged.
24.0% of adults in Port Orchard completed some college.
13.0% of adults in Port Orchard completed associate's degree.
25.0% of adults in Port Orchard completed bachelor's degree.
7.0% of adults in Port Orchard completed master's degree.
2.0% of adults in Port Orchard completed professional degree.
1.0% of adults in Port Orchard completed doctorate degree.
| Education | Port Orchard | WA | USA |
|---|---|---|---|
| < 9th Grade | 3.0% | 4.0% | 4.0% |
| 9-12th Grade | 3.0% | 4.0% | 6.0% |
| High School / GED | 22.0% | 22.0% | 26.0% |
| Some College | 24.0% | 21.0% | 19.0% |
| Associate's Degree | 13.0% | 10.0% | 9.0% |
| Bachelor's Degree | 25.0% | 24.0% | 22.0% |
| Master's Degree | 7.0% | 11.0% | 10.0% |
| Professional Degree | 2.0% | 2.0% | 2.0% |
| Doctorate Degree | 1.0% | 2.0% | 2.0% |
Household Income For Port Orchard, Washington
See the full breakdown
2.5% of households in Port Orchard earn Less than $10,000.
2.3% of households in Port Orchard earn $10,000 to $14,999.
3.2% of households in Port Orchard earn $15,000 to $24,999.
3.4% of households in Port Orchard earn $25,000 to $34,999.
9.7% of households in Port Orchard earn $35,000 to $49,999.
16.2% of households in Port Orchard earn $50,000 to $74,999.
15.2% of households in Port Orchard earn $75,000 to $99,999.
21.3% of households in Port Orchard earn $100,000 to $149,999.
14.9% of households in Port Orchard earn $150,000 to $199,999.
11.2% of households in Port Orchard earn $200,000 or more.
| Income | Port Orchard | WA | USA |
|---|---|---|---|
| Less than $10,000 | 2.5% | 3.9% | 5.0% |
| $10,000 to $14,999 | 2.3% | 2.5% | 3.4% |
| $15,000 to $24,999 | 3.2% | 4.6% | 6.3% |
| $25,000 to $34,999 | 3.4% | 5.0% | 6.6% |
| $35,000 to $49,999 | 9.7% | 8.2% | 10.1% |
| $50,000 to $74,999 | 16.2% | 14.1% | 15.5% |
| $75,000 to $99,999 | 15.2% | 12.4% | 12.6% |
| $100,000 to $149,999 | 21.3% | 19.2% | 17.5% |
| $150,000 to $199,999 | 14.9% | 11.4% | 9.6% |
| $200,000 or more | 11.2% | 18.5% | 13.4% |
Source: U.S. Census ACS 5-year estimates (2024)


