Centralia SnackAbility
Overall SnackAbility
Crime in Centralia summary. We use data from the FBI to determine the crime rates in Centralia. Key points include:
There were 569 total crimes in Centralia in the last reporting year.
The overall crime rate per 100,000 people in Centralia is 3,007.6 / 100k people.
The violent crime rate per 100,000 people in Centralia is 269.6 / 100k people.
The property crime rate per 100,000 people in Centralia is 2,738.0 / 100k people.
Overall, crime in Centralia is 41.92% above the national average.
Total Crimes
Above National Average
Crime In Centralia Comparison Table
| Statistic | Count Raw |
Centralia / 100k People |
Washington / 100k People |
National / 100k People |
|---|---|---|---|---|
| Total Crimes Per 100K | 569 | 3,007.6 | 2,792.6 | 2,119.2 |
| Violent Crime | 51 | 269.6 | 326.1 | 359.0 |
| Murder | 1 | 5.3 | 3.8 | 5.0 |
| Robbery | 11 | 58.1 | 67.5 | 61.0 |
| Aggravated Assault | 25 | 132.1 | 217.0 | 256.0 |
| Property Crime | 518 | 2,738.0 | 2,466.5 | 1,760.0 |
| Burglary | 75 | 396.4 | 398.8 | 229.0 |
| Larceny | 411 | 2,172.4 | 1,634.2 | 1,272.0 |
| Car Theft | 32 | 169.1 | 433.5 | 259.0 |
Source: FBI Uniform Crime Reporting (2024)
Cost of living in Centralia summary. We use data on the cost of living to determine how expensive it is to live in Centralia. Real estate prices drive most of the variance in cost of living around Washington. Key points include:
The cost of living in Centralia is 106 with 100 being average.
The cost of living in Centralia is 1.1x higher than the national average.
The median home value in Centralia is $395,612.
The median income in Centralia is $56,219.
Centralia's Overall Cost Of Living
Higher Than The National Average
Cost Of Living In Centralia Comparison Table
| Living Expense | Centralia | Washington | National Average |
|---|---|---|---|
| Overall | 106 | 120 | 100 |
| Services | 105 | 108 | 100 |
| Groceries | 112 | 108 | 100 |
| Health | 94 | 137 | 100 |
| Housing | 113 | 111 | 100 |
| Transportation | 109 | 111 | 100 |
| Utilities | 111 | 110 | 100 |
Source: Cost of living index, normalized to US average = 100
Centralia, WA Weather
The average high in Centralia is 61.5° and the average low is 41.7°.
There are 107.7 days of precipitation each year.
Expect an average of 47.1 inches of precipitation each year with 5.7 inches of snow.
| Stat | Centralia |
|---|---|
| Average Annual High | 61.5 |
| Average Annual Low | 41.7 |
| Annual Precipitation Days | 107.7 |
| Average Annual Precipitation | 47.1 |
| Average Annual Snowfall | 5.7 |
Average High
Days of Rain
Source: NOAA climate normals (30-year)
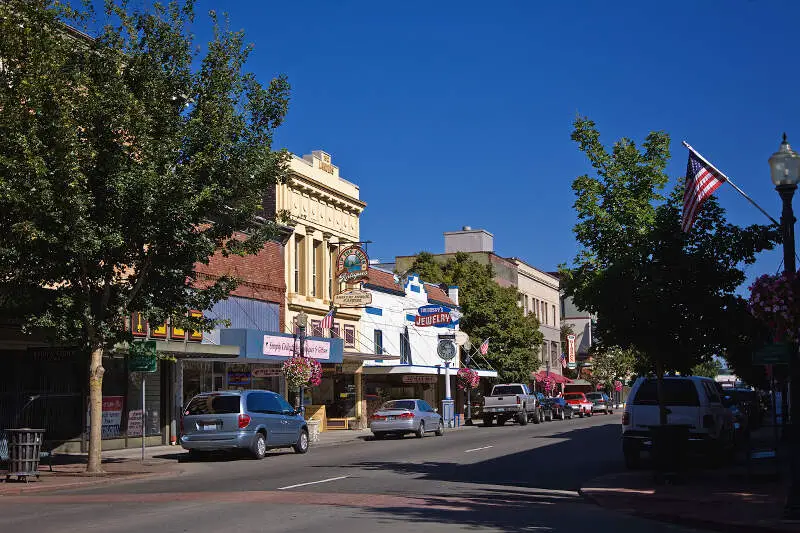
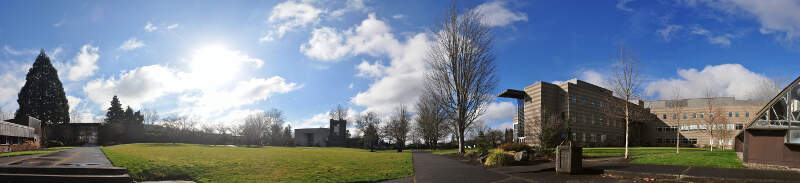
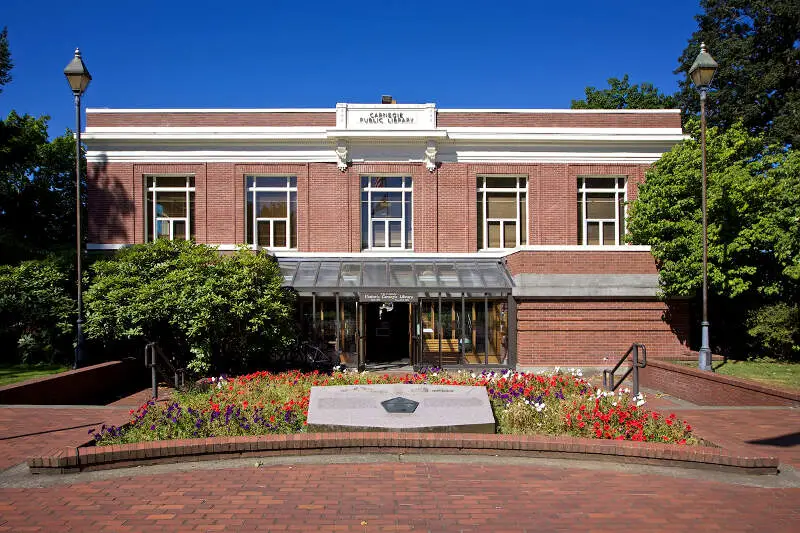
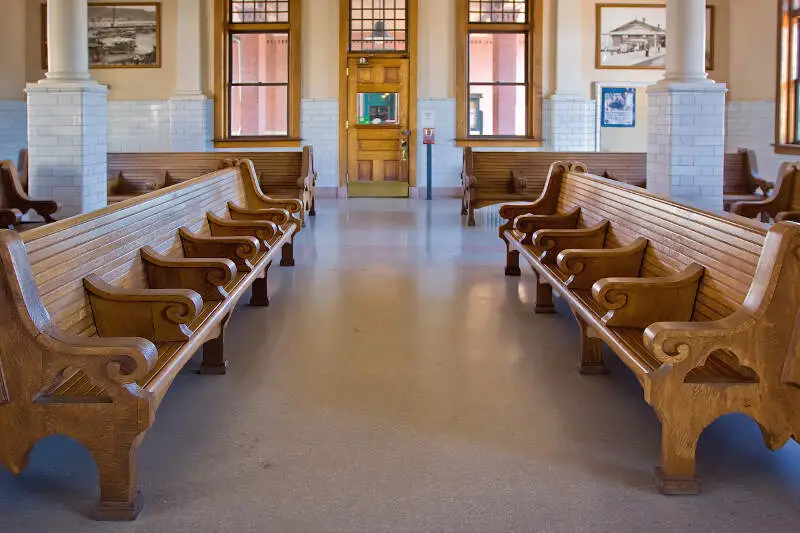
Centralia, WA Photos
2 Reviews & Comments About Centralia

I live in Centralia and it's really peaceful and quiet lol
The crime is surprisingly low. Yes there's drug activity but not enough to effect your day to day life. The school system is fairly decent, the teachers all care very much for the students and the schools are in the process of being remodeled the only issue I have seen is parents not being active enough in their child's education. The sports are what brings this town together, specifically the high schools football season, that is when the small town really becomes a community. Their is a local community college right in town as well. The housing market is fairly decent, homes that are for sale are fairly cheap but the rental market is very high for just the bare minimum apartments. There are a large selection of Low Income apartments and Affordable Housing apartments as well. There are many local resources for struggling families and the elderly such as WorkSource, Faith based Counseling and help held in and from the local churches, Community Action, and Housing Resource Center.
In my opinion the best places to visit when going to Centralia,WA is the Oly club on the downtown strip, the borst park off of Harrison's ave, and the yellow Big T BBQ off of Pearl St out towards the steam plant! The bad place however in my opinion are the downtown strip past 11 due to the homeless shelter then being closed, the shaefar parks woods area due to homeless people camping there as well, and the Hispanic trailer park off of long Road.
Rankings & Articles For Centralia


Locations Around Centralia
Map Of Centralia, WA
Best Places Around Centralia
Chehalis, WA
Population 7,587
Shelton, WA
Population 10,612
Gig Harbor, WA
Population 12,424
Kelso, WA
Population 12,684
Hoquiam, WA
Population 8,800
Aberdeen, WA
Population 17,088
Summit View, WA
Population 8,480
Fife, WA
Population 10,949
Parkland, WA
Population 38,742
Centralia Demographics And Statistics
Population over time in Centralia
The current population in Centralia is 18,830. The population has increased 16.5% from 2010.
| Year | Population | % Change |
|---|---|---|
| 2024 | 18,830 | 2.0% |
| 2023 | 18,457 | 1.2% |
| 2022 | 18,234 | 1.4% |
| 2021 | 17,988 | 2.9% |
| 2020 | 17,473 | 1.5% |
| 2019 | 17,216 | 1.7% |
| 2018 | 16,932 | 1.0% |
| 2017 | 16,771 | 0.3% |
| 2016 | 16,729 | 0.3% |
| 2015 | 16,683 | 0.1% |
| 2014 | 16,664 | 0.3% |
| 2013 | 16,611 | 1.4% |
| 2012 | 16,381 | 0.7% |
| 2011 | 16,272 | 0.6% |
| 2010 | 16,168 | - |
Race / Ethnicity in Centralia
See the full breakdown
Centralia is:
72.4% White with 13,631 White residents.
1.1% African American with 206 African American residents.
0.7% American Indian with 128 American Indian residents.
1.6% Asian with 298 Asian residents.
0.2% Hawaiian with 31 Hawaiian residents.
0.9% Other with 165 Other residents.
3.6% Two Or More with 669 Two Or More residents.
19.7% Hispanic with 3,702 Hispanic residents.
| Race | Centralia | WA | USA |
|---|---|---|---|
| White | 72.4% | 63.1% | 57.4% |
| African American | 1.1% | 3.8% | 11.9% |
| American Indian | 0.7% | 0.8% | 0.5% |
| Asian | 1.6% | 9.7% | 5.9% |
| Hawaiian | 0.2% | 0.7% | 0.2% |
| Other | 0.9% | 0.6% | 0.6% |
| Two Or More | 3.6% | 6.8% | 4.3% |
| Hispanic | 19.7% | 14.4% | 19.3% |
Gender in Centralia
See the full breakdown
Centralia is 51.6% female with 9,709 female residents.
Centralia is 48.4% male with 9,121 male residents.
| Gender | Centralia | WA | USA |
|---|---|---|---|
| Female | 51.6% | 49.6% | 50.5% |
| Male | 48.4% | 50.4% | 49.5% |
Highest level of educational attainment in Centralia for adults over 25
See the full breakdown
4.0% of adults in Centralia completed < 9th grade.
6.0% of adults in Centralia completed 9-12th grade.
32.0% of adults in Centralia completed high school / ged.
27.0% of adults in Centralia completed some college.
12.0% of adults in Centralia completed associate's degree.
13.0% of adults in Centralia completed bachelor's degree.
5.0% of adults in Centralia completed master's degree.
1.0% of adults in Centralia completed professional degree.
0.0% of adults in Centralia completed doctorate degree.
| Education | Centralia | WA | USA |
|---|---|---|---|
| < 9th Grade | 4.0% | 4.0% | 4.0% |
| 9-12th Grade | 6.0% | 4.0% | 6.0% |
| High School / GED | 32.0% | 22.0% | 26.0% |
| Some College | 27.0% | 21.0% | 19.0% |
| Associate's Degree | 12.0% | 10.0% | 9.0% |
| Bachelor's Degree | 13.0% | 24.0% | 22.0% |
| Master's Degree | 5.0% | 11.0% | 10.0% |
| Professional Degree | 1.0% | 2.0% | 2.0% |
| Doctorate Degree | 0.0% | 2.0% | 2.0% |
Household Income For Centralia, Washington
See the full breakdown
5.7% of households in Centralia earn Less than $10,000.
4.6% of households in Centralia earn $10,000 to $14,999.
9.8% of households in Centralia earn $15,000 to $24,999.
14.9% of households in Centralia earn $25,000 to $34,999.
12.4% of households in Centralia earn $35,000 to $49,999.
13.1% of households in Centralia earn $50,000 to $74,999.
13.0% of households in Centralia earn $75,000 to $99,999.
15.6% of households in Centralia earn $100,000 to $149,999.
8.0% of households in Centralia earn $150,000 to $199,999.
3.0% of households in Centralia earn $200,000 or more.
| Income | Centralia | WA | USA |
|---|---|---|---|
| Less than $10,000 | 5.7% | 3.9% | 5.0% |
| $10,000 to $14,999 | 4.6% | 2.5% | 3.4% |
| $15,000 to $24,999 | 9.8% | 4.6% | 6.3% |
| $25,000 to $34,999 | 14.9% | 5.0% | 6.6% |
| $35,000 to $49,999 | 12.4% | 8.2% | 10.1% |
| $50,000 to $74,999 | 13.1% | 14.1% | 15.5% |
| $75,000 to $99,999 | 13.0% | 12.4% | 12.6% |
| $100,000 to $149,999 | 15.6% | 19.2% | 17.5% |
| $150,000 to $199,999 | 8.0% | 11.4% | 9.6% |
| $200,000 or more | 3.0% | 18.5% | 13.4% |
Source: U.S. Census ACS 5-year estimates (2024)


