Shelton SnackAbility
Overall SnackAbility
Crime in Shelton summary. We use data from the FBI to determine the crime rates in Shelton. Key points include:
There were 314 total crimes in Shelton in the last reporting year.
The overall crime rate per 100,000 people in Shelton is 2,872.0 / 100k people.
The violent crime rate per 100,000 people in Shelton is 475.6 / 100k people.
The property crime rate per 100,000 people in Shelton is 2,396.4 / 100k people.
Overall, crime in Shelton is 35.52% above the national average.
Total Crimes
Above National Average
Crime In Shelton Comparison Table
| Statistic | Count Raw |
Shelton / 100k People |
Washington / 100k People |
National / 100k People |
|---|---|---|---|---|
| Total Crimes Per 100K | 314 | 2,872.0 | 2,792.6 | 2,119.2 |
| Violent Crime | 52 | 475.6 | 326.1 | 359.0 |
| Murder | 0 | 0.0 | 3.8 | 5.0 |
| Robbery | 9 | 82.3 | 67.5 | 61.0 |
| Aggravated Assault | 29 | 265.3 | 217.0 | 256.0 |
| Property Crime | 262 | 2,396.4 | 2,466.5 | 1,760.0 |
| Burglary | 44 | 402.5 | 398.8 | 229.0 |
| Larceny | 183 | 1,673.8 | 1,634.2 | 1,272.0 |
| Car Theft | 35 | 320.1 | 433.5 | 259.0 |
Source: FBI Uniform Crime Reporting (2024)
Cost of living in Shelton summary. We use data on the cost of living to determine how expensive it is to live in Shelton. Real estate prices drive most of the variance in cost of living around Washington. Key points include:
The cost of living in Shelton is 109 with 100 being average.
The cost of living in Shelton is 1.1x higher than the national average.
The median home value in Shelton is $422,091.
The median income in Shelton is $69,598.
Shelton's Overall Cost Of Living
Higher Than The National Average
Cost Of Living In Shelton Comparison Table
| Living Expense | Shelton | Washington | National Average |
|---|---|---|---|
| Overall | 109 | 120 | 100 |
| Services | 106 | 108 | 100 |
| Groceries | 110 | 108 | 100 |
| Health | 101 | 137 | 100 |
| Housing | 113 | 111 | 100 |
| Transportation | 111 | 111 | 100 |
| Utilities | 111 | 110 | 100 |
Source: Cost of living index, normalized to US average = 100
Shelton, WA Weather
The average high in Shelton is 60.3° and the average low is 42.0°.
There are 119.2 days of precipitation each year.
Expect an average of 62.3 inches of precipitation each year with 5.7 inches of snow.
| Stat | Shelton |
|---|---|
| Average Annual High | 60.3 |
| Average Annual Low | 42.0 |
| Annual Precipitation Days | 119.2 |
| Average Annual Precipitation | 62.3 |
| Average Annual Snowfall | 5.7 |
Average High
Days of Rain
Source: NOAA climate normals (30-year)
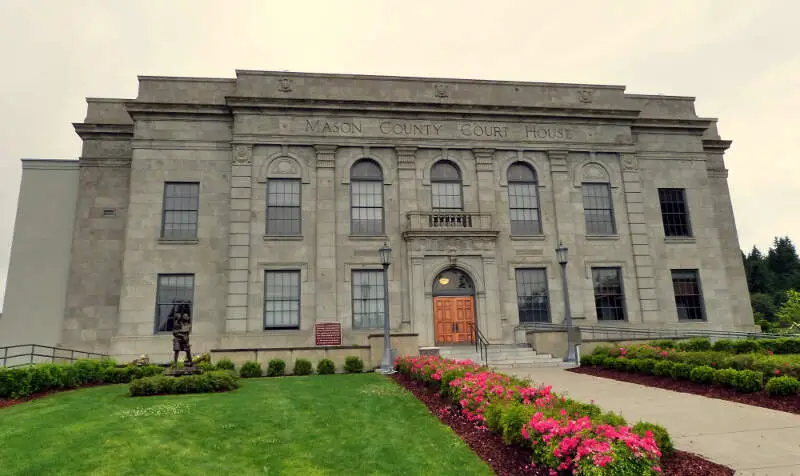
Shelton, WA Photos
1 Reviews & Comments About Shelton

Like many lower income small cities around the US. Families doing their best to get on. Crime is present for sure. Not much imagination on the part of local officials who could be taking advantage of the spectacular setting of the town. The water and the Olympic Mountains!
Homeless are almost non-existant even at the bus station. Way better experience that Seattle or Olympia and nowhere near as rough as Burien or Tacoma!
Rankings & Articles For Shelton


Locations Around Shelton
Map Of Shelton, WA
Best Places Around Shelton
Chehalis, WA
Population 7,587
Centralia, WA
Population 18,830
Gig Harbor, WA
Population 12,424
Bremerton, WA
Population 44,830
Hoquiam, WA
Population 8,800
Aberdeen, WA
Population 17,088
Port Orchard, WA
Population 17,149
Summit View, WA
Population 8,480
Fife, WA
Population 10,949
Parkland, WA
Population 38,742
Shelton Demographics And Statistics
Population over time in Shelton
The current population in Shelton is 10,612. The population has increased 9.4% from 2010.
| Year | Population | % Change |
|---|---|---|
| 2024 | 10,612 | -0.1% |
| 2023 | 10,619 | 1.3% |
| 2022 | 10,484 | 1.9% |
| 2021 | 10,288 | -1.7% |
| 2020 | 10,467 | 3.0% |
| 2019 | 10,167 | 1.7% |
| 2018 | 9,996 | 1.2% |
| 2017 | 9,882 | 0.5% |
| 2016 | 9,832 | 0.2% |
| 2015 | 9,810 | 0.1% |
| 2014 | 9,798 | -0.3% |
| 2013 | 9,830 | 0.2% |
| 2012 | 9,814 | 0.2% |
| 2011 | 9,794 | 1.0% |
| 2010 | 9,699 | - |
Race / Ethnicity in Shelton
See the full breakdown
Shelton is:
63.3% White with 6,716 White residents.
0.3% African American with 28 African American residents.
1.1% American Indian with 120 American Indian residents.
0.9% Asian with 92 Asian residents.
0.2% Hawaiian with 17 Hawaiian residents.
0.0% Other with 0 Other residents.
6.1% Two Or More with 643 Two Or More residents.
28.2% Hispanic with 2,996 Hispanic residents.
| Race | Shelton | WA | USA |
|---|---|---|---|
| White | 63.3% | 63.1% | 57.4% |
| African American | 0.3% | 3.8% | 11.9% |
| American Indian | 1.1% | 0.8% | 0.5% |
| Asian | 0.9% | 9.7% | 5.9% |
| Hawaiian | 0.2% | 0.7% | 0.2% |
| Other | 0.0% | 0.6% | 0.6% |
| Two Or More | 6.1% | 6.8% | 4.3% |
| Hispanic | 28.2% | 14.4% | 19.3% |
Gender in Shelton
See the full breakdown
Shelton is 52.0% female with 5,517 female residents.
Shelton is 48.0% male with 5,095 male residents.
| Gender | Shelton | WA | USA |
|---|---|---|---|
| Female | 52.0% | 49.6% | 50.5% |
| Male | 48.0% | 50.4% | 49.5% |
Highest level of educational attainment in Shelton for adults over 25
See the full breakdown
7.0% of adults in Shelton completed < 9th grade.
9.0% of adults in Shelton completed 9-12th grade.
32.0% of adults in Shelton completed high school / ged.
25.0% of adults in Shelton completed some college.
8.0% of adults in Shelton completed associate's degree.
15.0% of adults in Shelton completed bachelor's degree.
4.0% of adults in Shelton completed master's degree.
0.0% of adults in Shelton completed professional degree.
0.0% of adults in Shelton completed doctorate degree.
| Education | Shelton | WA | USA |
|---|---|---|---|
| < 9th Grade | 7.0% | 4.0% | 4.0% |
| 9-12th Grade | 9.0% | 4.0% | 6.0% |
| High School / GED | 32.0% | 22.0% | 26.0% |
| Some College | 25.0% | 21.0% | 19.0% |
| Associate's Degree | 8.0% | 10.0% | 9.0% |
| Bachelor's Degree | 15.0% | 24.0% | 22.0% |
| Master's Degree | 4.0% | 11.0% | 10.0% |
| Professional Degree | 0.0% | 2.0% | 2.0% |
| Doctorate Degree | 0.0% | 2.0% | 2.0% |
Household Income For Shelton, Washington
See the full breakdown
4.9% of households in Shelton earn Less than $10,000.
6.3% of households in Shelton earn $10,000 to $14,999.
7.8% of households in Shelton earn $15,000 to $24,999.
7.8% of households in Shelton earn $25,000 to $34,999.
7.9% of households in Shelton earn $35,000 to $49,999.
18.7% of households in Shelton earn $50,000 to $74,999.
12.5% of households in Shelton earn $75,000 to $99,999.
23.5% of households in Shelton earn $100,000 to $149,999.
6.2% of households in Shelton earn $150,000 to $199,999.
4.4% of households in Shelton earn $200,000 or more.
| Income | Shelton | WA | USA |
|---|---|---|---|
| Less than $10,000 | 4.9% | 3.9% | 5.0% |
| $10,000 to $14,999 | 6.3% | 2.5% | 3.4% |
| $15,000 to $24,999 | 7.8% | 4.6% | 6.3% |
| $25,000 to $34,999 | 7.8% | 5.0% | 6.6% |
| $35,000 to $49,999 | 7.9% | 8.2% | 10.1% |
| $50,000 to $74,999 | 18.7% | 14.1% | 15.5% |
| $75,000 to $99,999 | 12.5% | 12.4% | 12.6% |
| $100,000 to $149,999 | 23.5% | 19.2% | 17.5% |
| $150,000 to $199,999 | 6.2% | 11.4% | 9.6% |
| $200,000 or more | 4.4% | 18.5% | 13.4% |
Source: U.S. Census ACS 5-year estimates (2024)


