Edmonds SnackAbility
Overall SnackAbility
Crime in Edmonds summary. We use data from the FBI to determine the crime rates in Edmonds. Key points include:
There were 1,391 total crimes in Edmonds in the last reporting year.
The overall crime rate per 100,000 people in Edmonds is 3,260.7 / 100k people.
The violent crime rate per 100,000 people in Edmonds is 260.2 / 100k people.
The property crime rate per 100,000 people in Edmonds is 3,000.5 / 100k people.
Overall, crime in Edmonds is 53.86% above the national average.
Total Crimes
Above National Average
Crime In Edmonds Comparison Table
| Statistic | Count Raw |
Edmonds / 100k People |
Washington / 100k People |
National / 100k People |
|---|---|---|---|---|
| Total Crimes Per 100K | 1,391 | 3,260.7 | 2,792.6 | 2,119.2 |
| Violent Crime | 111 | 260.2 | 326.1 | 359.0 |
| Murder | 1 | 2.3 | 3.8 | 5.0 |
| Robbery | 22 | 51.6 | 67.5 | 61.0 |
| Aggravated Assault | 72 | 168.8 | 217.0 | 256.0 |
| Property Crime | 1,280 | 3,000.5 | 2,466.5 | 1,760.0 |
| Burglary | 176 | 412.6 | 398.8 | 229.0 |
| Larceny | 1,039 | 2,435.6 | 1,634.2 | 1,272.0 |
| Car Theft | 65 | 152.4 | 433.5 | 259.0 |
Source: FBI Uniform Crime Reporting (2024)
Cost of living in Edmonds summary. We use data on the cost of living to determine how expensive it is to live in Edmonds. Real estate prices drive most of the variance in cost of living around Washington. Key points include:
The cost of living in Edmonds is 160 with 100 being average.
The cost of living in Edmonds is 1.6x higher than the national average.
The median home value in Edmonds is $942,130.
The median income in Edmonds is $122,449.
Edmonds's Overall Cost Of Living
Higher Than The National Average
Cost Of Living In Edmonds Comparison Table
| Living Expense | Edmonds | Washington | National Average |
|---|---|---|---|
| Overall | 160 | 120 | 100 |
| Services | 109 | 108 | 100 |
| Groceries | 108 | 108 | 100 |
| Health | 279 | 137 | 100 |
| Housing | 110 | 111 | 100 |
| Transportation | 110 | 111 | 100 |
| Utilities | 108 | 110 | 100 |
Source: Cost of living index, normalized to US average = 100
Edmonds, WA Weather
The average high in Edmonds is 59.4° and the average low is 44.1°.
There are 107.7 days of precipitation each year.
Expect an average of 37.5 inches of precipitation each year with 4.3 inches of snow.
| Stat | Edmonds |
|---|---|
| Average Annual High | 59.4 |
| Average Annual Low | 44.1 |
| Annual Precipitation Days | 107.7 |
| Average Annual Precipitation | 37.5 |
| Average Annual Snowfall | 4.3 |
Average High
Days of Rain
Source: NOAA climate normals (30-year)
Edmonds, WA Photos
1 Reviews & Comments About Edmonds

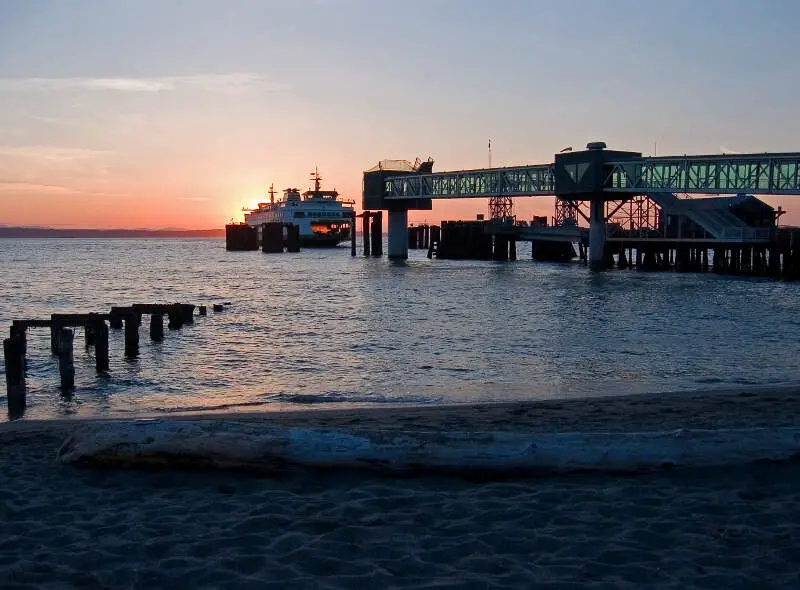
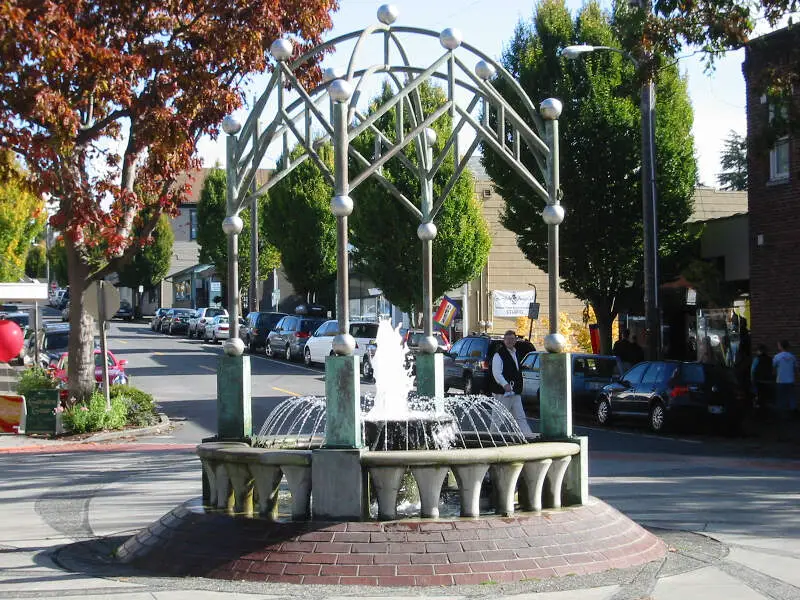
Edmonds was a safe feeling place spend a day. The crime rate is much lower than nearby Seattle, and the streets are kept up nicely. Edmonds' "Bowl" is a natural amphitheater that sits above the little town, which is perched on the shore of Puget Sound.
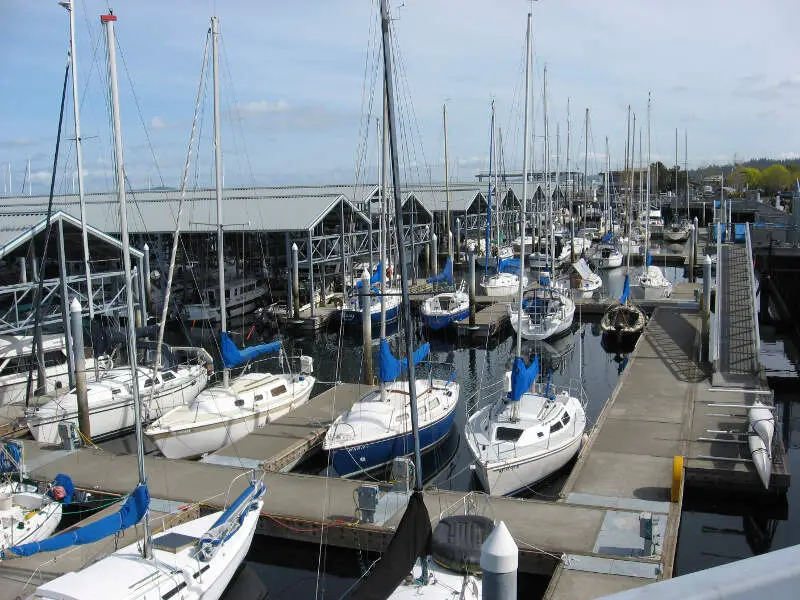
Favorite places were the waterfront with the fishing pier and ferry dock and marina. It was a great place to eat, walk, look at pretty boat or even to take a whale watching tour. Up the hill a few blocks the downtown area was easy to walk and had many interesting stores and shops to explore. There seemed to be a great restaurant on every block, too.
Rankings & Articles For Edmonds


Locations Around Edmonds
Map Of Edmonds, WA
Best Places Around Edmonds
Bangor Base, WA
Population 6,112
Bainbridge Island, WA
Population 24,631
Poulsbo, WA
Population 12,165
Snohomish, WA
Population 10,239
Everett, WA
Population 111,845
Silverdale, WA
Population 20,685
Lake Stickney, WA
Population 15,890
Lake Stevens, WA
Population 40,253
Monroe, WA
Population 19,755
Lynnwood, WA
Population 40,110
Edmonds Demographics And Statistics
Population over time in Edmonds
The current population in Edmonds is 42,735. The population has increased 7.7% from 2010.
| Year | Population | % Change |
|---|---|---|
| 2024 | 42,735 | -0.1% |
| 2023 | 42,783 | 0.2% |
| 2022 | 42,705 | 0.2% |
| 2021 | 42,622 | 0.6% |
| 2020 | 42,347 | 0.7% |
| 2019 | 42,040 | 0.6% |
| 2018 | 41,770 | 1.1% |
| 2017 | 41,309 | 0.7% |
| 2016 | 41,020 | 0.8% |
| 2015 | 40,689 | 0.9% |
| 2014 | 40,343 | 0.5% |
| 2013 | 40,139 | 0.5% |
| 2012 | 39,925 | 0.3% |
| 2011 | 39,821 | 0.4% |
| 2010 | 39,682 | - |
Race / Ethnicity in Edmonds
See the full breakdown
Edmonds is:
72.5% White with 30,991 White residents.
2.3% African American with 962 African American residents.
0.4% American Indian with 153 American Indian residents.
10.0% Asian with 4,276 Asian residents.
0.9% Hawaiian with 403 Hawaiian residents.
0.6% Other with 246 Other residents.
7.3% Two Or More with 3,099 Two Or More residents.
6.1% Hispanic with 2,605 Hispanic residents.
| Race | Edmonds | WA | USA |
|---|---|---|---|
| White | 72.5% | 63.1% | 57.4% |
| African American | 2.3% | 3.8% | 11.9% |
| American Indian | 0.4% | 0.8% | 0.5% |
| Asian | 10.0% | 9.7% | 5.9% |
| Hawaiian | 0.9% | 0.7% | 0.2% |
| Other | 0.6% | 0.6% | 0.6% |
| Two Or More | 7.3% | 6.8% | 4.3% |
| Hispanic | 6.1% | 14.4% | 19.3% |
Gender in Edmonds
See the full breakdown
Edmonds is 52.9% female with 22,594 female residents.
Edmonds is 47.1% male with 20,140 male residents.
| Gender | Edmonds | WA | USA |
|---|---|---|---|
| Female | 52.9% | 49.6% | 50.5% |
| Male | 47.1% | 50.4% | 49.5% |
Highest level of educational attainment in Edmonds for adults over 25
See the full breakdown
1.0% of adults in Edmonds completed < 9th grade.
1.0% of adults in Edmonds completed 9-12th grade.
16.0% of adults in Edmonds completed high school / ged.
19.0% of adults in Edmonds completed some college.
9.0% of adults in Edmonds completed associate's degree.
33.0% of adults in Edmonds completed bachelor's degree.
15.0% of adults in Edmonds completed master's degree.
4.0% of adults in Edmonds completed professional degree.
2.0% of adults in Edmonds completed doctorate degree.
| Education | Edmonds | WA | USA |
|---|---|---|---|
| < 9th Grade | 1.0% | 4.0% | 4.0% |
| 9-12th Grade | 1.0% | 4.0% | 6.0% |
| High School / GED | 16.0% | 22.0% | 26.0% |
| Some College | 19.0% | 21.0% | 19.0% |
| Associate's Degree | 9.0% | 10.0% | 9.0% |
| Bachelor's Degree | 33.0% | 24.0% | 22.0% |
| Master's Degree | 15.0% | 11.0% | 10.0% |
| Professional Degree | 4.0% | 2.0% | 2.0% |
| Doctorate Degree | 2.0% | 2.0% | 2.0% |
Household Income For Edmonds, Washington
See the full breakdown
1.5% of households in Edmonds earn Less than $10,000.
1.0% of households in Edmonds earn $10,000 to $14,999.
3.9% of households in Edmonds earn $15,000 to $24,999.
4.2% of households in Edmonds earn $25,000 to $34,999.
5.6% of households in Edmonds earn $35,000 to $49,999.
13.0% of households in Edmonds earn $50,000 to $74,999.
11.9% of households in Edmonds earn $75,000 to $99,999.
17.7% of households in Edmonds earn $100,000 to $149,999.
12.7% of households in Edmonds earn $150,000 to $199,999.
28.5% of households in Edmonds earn $200,000 or more.
| Income | Edmonds | WA | USA |
|---|---|---|---|
| Less than $10,000 | 1.5% | 3.9% | 5.0% |
| $10,000 to $14,999 | 1.0% | 2.5% | 3.4% |
| $15,000 to $24,999 | 3.9% | 4.6% | 6.3% |
| $25,000 to $34,999 | 4.2% | 5.0% | 6.6% |
| $35,000 to $49,999 | 5.6% | 8.2% | 10.1% |
| $50,000 to $74,999 | 13.0% | 14.1% | 15.5% |
| $75,000 to $99,999 | 11.9% | 12.4% | 12.6% |
| $100,000 to $149,999 | 17.7% | 19.2% | 17.5% |
| $150,000 to $199,999 | 12.7% | 11.4% | 9.6% |
| $200,000 or more | 28.5% | 18.5% | 13.4% |
Source: U.S. Census ACS 5-year estimates (2024)


