Everett SnackAbility
Overall SnackAbility
Crime in Everett summary. We use data from the FBI to determine the crime rates in Everett. Key points include:
There were 3,877 total crimes in Everett in the last reporting year.
The overall crime rate per 100,000 people in Everett is 3,484.1 / 100k people.
The violent crime rate per 100,000 people in Everett is 265.1 / 100k people.
The property crime rate per 100,000 people in Everett is 3,219.0 / 100k people.
Overall, crime in Everett is 64.41% above the national average.
Total Crimes
Above National Average
Crime In Everett Comparison Table
| Statistic | Count Raw |
Everett / 100k People |
Washington / 100k People |
National / 100k People |
|---|---|---|---|---|
| Total Crimes Per 100K | 3,877 | 3,484.1 | 2,792.6 | 2,119.2 |
| Violent Crime | 295 | 265.1 | 326.1 | 359.0 |
| Murder | 6 | 5.4 | 3.8 | 5.0 |
| Robbery | 75 | 67.4 | 67.5 | 61.0 |
| Aggravated Assault | 178 | 160.0 | 217.0 | 256.0 |
| Property Crime | 3,582 | 3,219.0 | 2,466.5 | 1,760.0 |
| Burglary | 395 | 355.0 | 398.8 | 229.0 |
| Larceny | 2,293 | 2,060.6 | 1,634.2 | 1,272.0 |
| Car Theft | 894 | 803.4 | 433.5 | 259.0 |
Source: FBI Uniform Crime Reporting (2024)
Cost of living in Everett summary. We use data on the cost of living to determine how expensive it is to live in Everett. Real estate prices drive most of the variance in cost of living around Washington. Key points include:
The cost of living in Everett is 132 with 100 being average.
The cost of living in Everett is 1.3x higher than the national average.
The median home value in Everett is $662,785.
The median income in Everett is $83,512.
Everett's Overall Cost Of Living
Higher Than The National Average
Cost Of Living In Everett Comparison Table
| Living Expense | Everett | Washington | National Average |
|---|---|---|---|
| Overall | 132 | 120 | 100 |
| Services | 109 | 108 | 100 |
| Groceries | 113 | 108 | 100 |
| Health | 183 | 137 | 100 |
| Housing | 110 | 111 | 100 |
| Transportation | 114 | 111 | 100 |
| Utilities | 111 | 110 | 100 |
Source: Cost of living index, normalized to US average = 100
Everett, WA Weather
The average high in Everett is 58.4° and the average low is 43.7°.
There are 100.6 days of precipitation each year.
Expect an average of 36.5 inches of precipitation each year with 3.8 inches of snow.
| Stat | Everett |
|---|---|
| Average Annual High | 58.4 |
| Average Annual Low | 43.7 |
| Annual Precipitation Days | 100.6 |
| Average Annual Precipitation | 36.5 |
| Average Annual Snowfall | 3.8 |
Average High
Days of Rain
Source: NOAA climate normals (30-year)
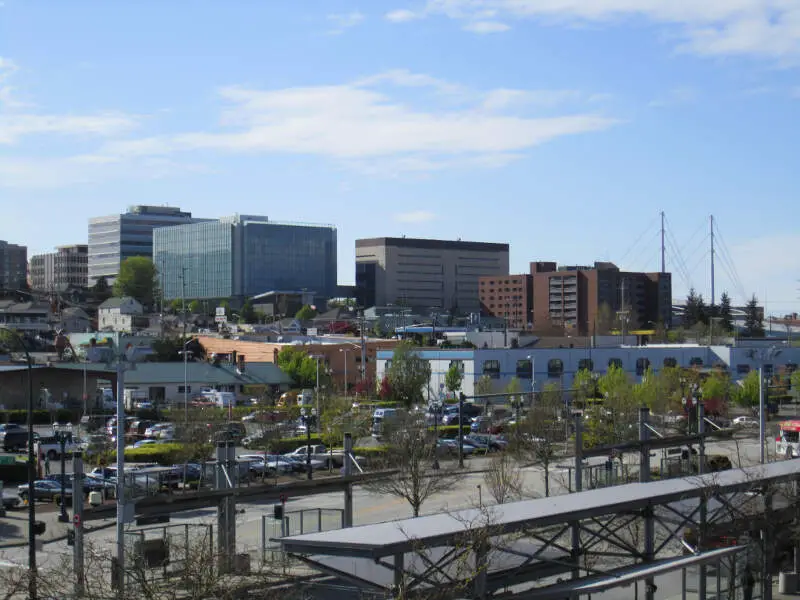
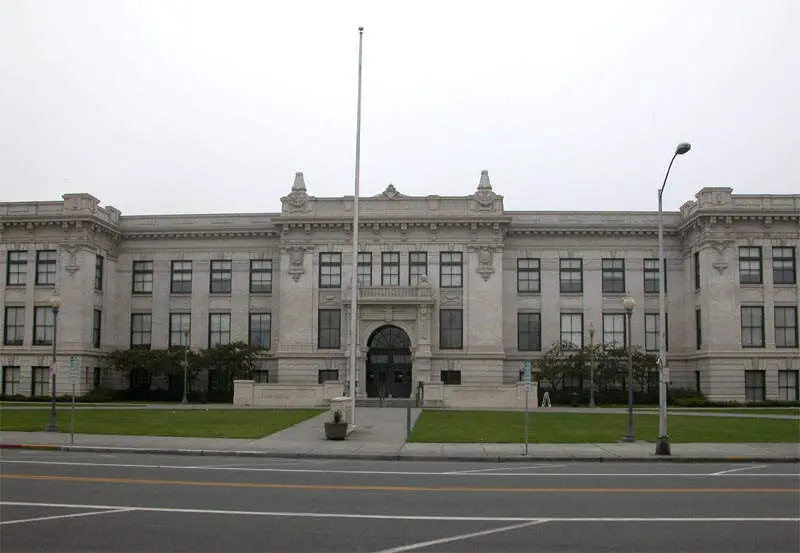
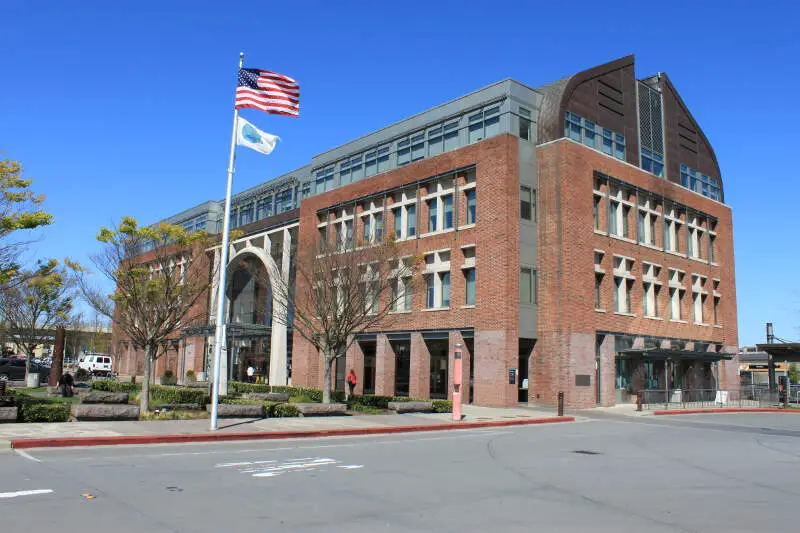
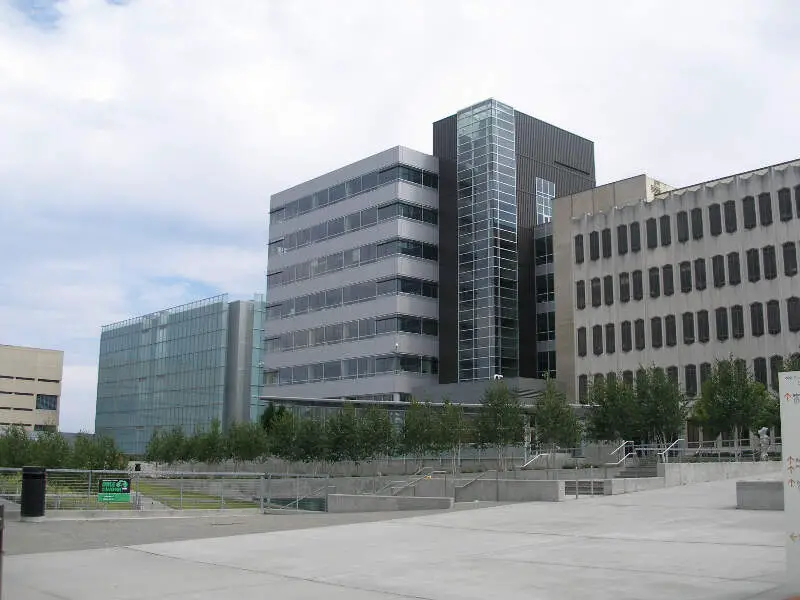
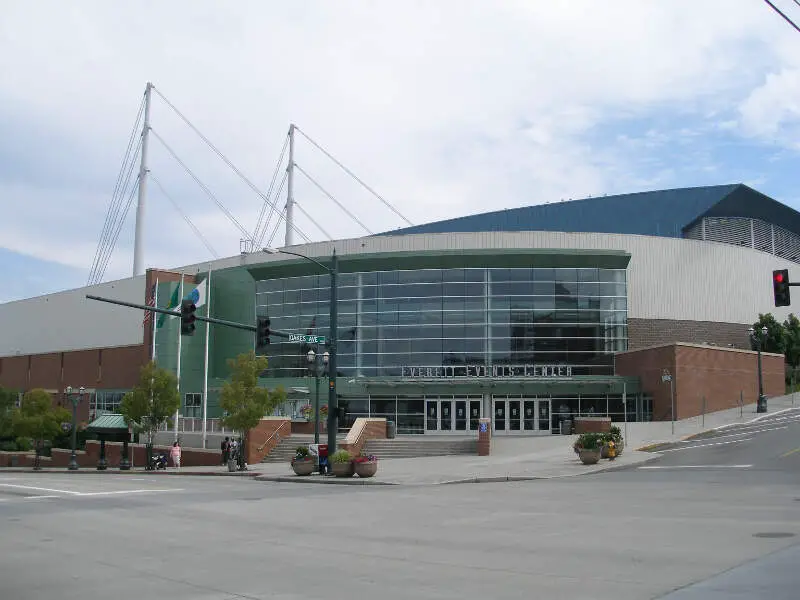
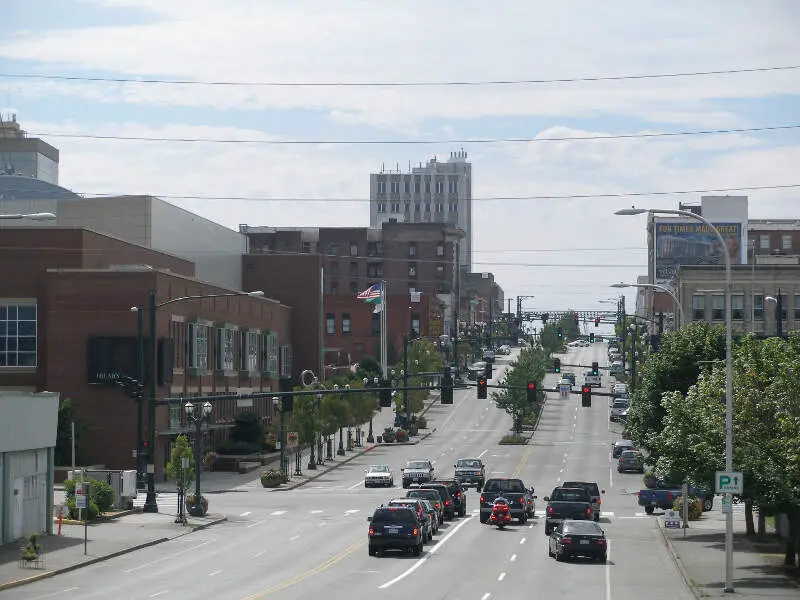
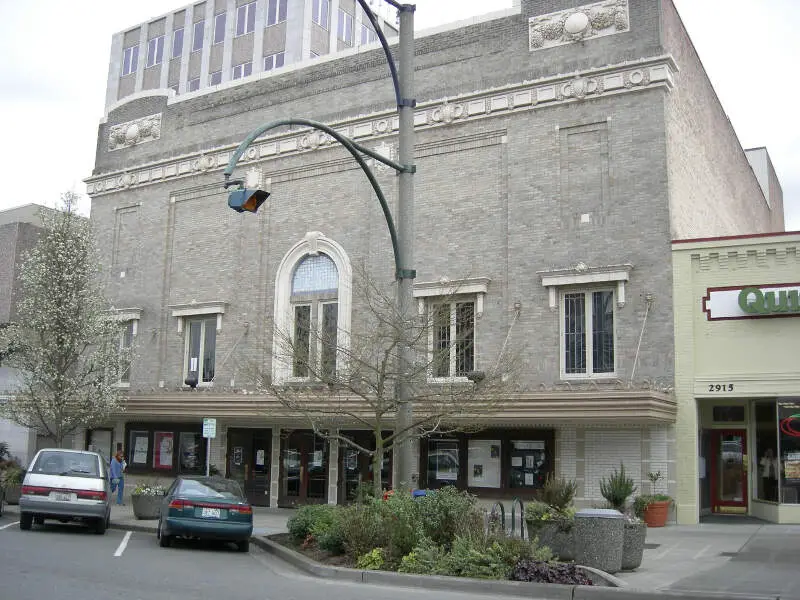
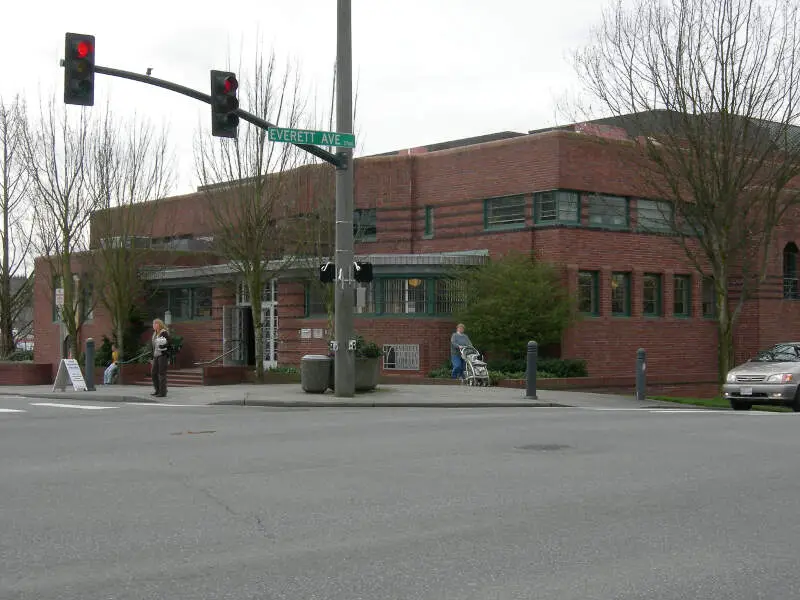
Everett, WA Photos
Rankings & Articles For Everett


Locations Around Everett
Map Of Everett, WA
Best Places Around Everett
Snohomish, WA
Population 10,239
Arlington, WA
Population 21,095
Lake Stickney, WA
Population 15,890
Lake Stevens, WA
Population 40,253
Monroe, WA
Population 19,755
Lynnwood, WA
Population 40,110
North Lynnwood, WA
Population 23,339
Woodinville, WA
Population 13,438
Woods Creek, WA
Population 6,943
Martha Lake, WA
Population 22,634
Everett Demographics And Statistics
Population over time in Everett
The current population in Everett is 111,845. The population has increased 10.0% from 2010.
| Year | Population | % Change |
|---|---|---|
| 2024 | 111,845 | 0.7% |
| 2023 | 111,083 | 0.2% |
| 2022 | 110,847 | 0.4% |
| 2021 | 110,438 | -0.4% |
| 2020 | 110,840 | 1.0% |
| 2019 | 109,766 | 0.8% |
| 2018 | 108,941 | 1.3% |
| 2017 | 107,560 | 0.9% |
| 2016 | 106,580 | 0.8% |
| 2015 | 105,685 | 0.9% |
| 2014 | 104,708 | 0.8% |
| 2013 | 103,918 | 0.8% |
| 2012 | 103,135 | 0.6% |
| 2011 | 102,569 | 0.9% |
| 2010 | 101,667 | - |
Race / Ethnicity in Everett
See the full breakdown
Everett is:
56.9% White with 63,694 White residents.
6.1% African American with 6,802 African American residents.
0.3% American Indian with 335 American Indian residents.
10.0% Asian with 11,232 Asian residents.
0.9% Hawaiian with 1,041 Hawaiian residents.
0.5% Other with 553 Other residents.
7.1% Two Or More with 7,974 Two Or More residents.
18.1% Hispanic with 20,214 Hispanic residents.
| Race | Everett | WA | USA |
|---|---|---|---|
| White | 56.9% | 63.1% | 57.4% |
| African American | 6.1% | 3.8% | 11.9% |
| American Indian | 0.3% | 0.8% | 0.5% |
| Asian | 10.0% | 9.7% | 5.9% |
| Hawaiian | 0.9% | 0.7% | 0.2% |
| Other | 0.5% | 0.6% | 0.6% |
| Two Or More | 7.1% | 6.8% | 4.3% |
| Hispanic | 18.1% | 14.4% | 19.3% |
Gender in Everett
See the full breakdown
Everett is 48.2% female with 53,861 female residents.
Everett is 51.8% male with 57,984 male residents.
| Gender | Everett | WA | USA |
|---|---|---|---|
| Female | 48.2% | 49.6% | 50.5% |
| Male | 51.8% | 50.4% | 49.5% |
Highest level of educational attainment in Everett for adults over 25
See the full breakdown
3.0% of adults in Everett completed < 9th grade.
7.0% of adults in Everett completed 9-12th grade.
27.0% of adults in Everett completed high school / ged.
24.0% of adults in Everett completed some college.
10.0% of adults in Everett completed associate's degree.
20.0% of adults in Everett completed bachelor's degree.
7.0% of adults in Everett completed master's degree.
2.0% of adults in Everett completed professional degree.
0.0% of adults in Everett completed doctorate degree.
| Education | Everett | WA | USA |
|---|---|---|---|
| < 9th Grade | 3.0% | 4.0% | 4.0% |
| 9-12th Grade | 7.0% | 4.0% | 6.0% |
| High School / GED | 27.0% | 22.0% | 26.0% |
| Some College | 24.0% | 21.0% | 19.0% |
| Associate's Degree | 10.0% | 10.0% | 9.0% |
| Bachelor's Degree | 20.0% | 24.0% | 22.0% |
| Master's Degree | 7.0% | 11.0% | 10.0% |
| Professional Degree | 2.0% | 2.0% | 2.0% |
| Doctorate Degree | 0.0% | 2.0% | 2.0% |
Household Income For Everett, Washington
See the full breakdown
4.3% of households in Everett earn Less than $10,000.
3.5% of households in Everett earn $10,000 to $14,999.
5.7% of households in Everett earn $15,000 to $24,999.
4.9% of households in Everett earn $25,000 to $34,999.
9.0% of households in Everett earn $35,000 to $49,999.
18.0% of households in Everett earn $50,000 to $74,999.
13.9% of households in Everett earn $75,000 to $99,999.
19.5% of households in Everett earn $100,000 to $149,999.
10.5% of households in Everett earn $150,000 to $199,999.
10.7% of households in Everett earn $200,000 or more.
| Income | Everett | WA | USA |
|---|---|---|---|
| Less than $10,000 | 4.3% | 3.9% | 5.0% |
| $10,000 to $14,999 | 3.5% | 2.5% | 3.4% |
| $15,000 to $24,999 | 5.7% | 4.6% | 6.3% |
| $25,000 to $34,999 | 4.9% | 5.0% | 6.6% |
| $35,000 to $49,999 | 9.0% | 8.2% | 10.1% |
| $50,000 to $74,999 | 18.0% | 14.1% | 15.5% |
| $75,000 to $99,999 | 13.9% | 12.4% | 12.6% |
| $100,000 to $149,999 | 19.5% | 19.2% | 17.5% |
| $150,000 to $199,999 | 10.5% | 11.4% | 9.6% |
| $200,000 or more | 10.7% | 18.5% | 13.4% |
Source: U.S. Census ACS 5-year estimates (2024)


