Ellensburg SnackAbility
Overall SnackAbility
Crime in Ellensburg summary. We use data from the FBI to determine the crime rates in Ellensburg. Key points include:
There were 445 total crimes in Ellensburg in the last reporting year.
The overall crime rate per 100,000 people in Ellensburg is 2,409.1 / 100k people.
The violent crime rate per 100,000 people in Ellensburg is 227.4 / 100k people.
The property crime rate per 100,000 people in Ellensburg is 2,181.7 / 100k people.
Overall, crime in Ellensburg is 13.68% above the national average.
Total Crimes
Above National Average
Crime In Ellensburg Comparison Table
| Statistic | Count Raw |
Ellensburg / 100k People |
Washington / 100k People |
National / 100k People |
|---|---|---|---|---|
| Total Crimes Per 100K | 445 | 2,409.1 | 2,792.6 | 2,119.2 |
| Violent Crime | 42 | 227.4 | 326.1 | 359.0 |
| Murder | 1 | 5.4 | 3.8 | 5.0 |
| Robbery | 4 | 21.7 | 67.5 | 61.0 |
| Aggravated Assault | 20 | 108.3 | 217.0 | 256.0 |
| Property Crime | 403 | 2,181.7 | 2,466.5 | 1,760.0 |
| Burglary | 45 | 243.6 | 398.8 | 229.0 |
| Larceny | 343 | 1,856.9 | 1,634.2 | 1,272.0 |
| Car Theft | 15 | 81.2 | 433.5 | 259.0 |
Source: FBI Uniform Crime Reporting (2024)
Cost of living in Ellensburg summary. We use data on the cost of living to determine how expensive it is to live in Ellensburg. Real estate prices drive most of the variance in cost of living around Washington. Key points include:
The cost of living in Ellensburg is 118 with 100 being average.
The cost of living in Ellensburg is 1.2x higher than the national average.
The median home value in Ellensburg is $453,797.
The median income in Ellensburg is $55,438.
Ellensburg's Overall Cost Of Living
Higher Than The National Average
Cost Of Living In Ellensburg Comparison Table
| Living Expense | Ellensburg | Washington | National Average |
|---|---|---|---|
| Overall | 118 | 120 | 100 |
| Services | 108 | 108 | 100 |
| Groceries | 109 | 108 | 100 |
| Health | 126 | 137 | 100 |
| Housing | 111 | 111 | 100 |
| Transportation | 113 | 111 | 100 |
| Utilities | 118 | 110 | 100 |
Source: Cost of living index, normalized to US average = 100
Ellensburg, WA Weather
The average high in Ellensburg is 60.3° and the average low is 37.0°.
There are 29.1 days of precipitation each year.
Expect an average of 8.5 inches of precipitation each year with 21.9 inches of snow.
| Stat | Ellensburg |
|---|---|
| Average Annual High | 60.3 |
| Average Annual Low | 37.0 |
| Annual Precipitation Days | 29.1 |
| Average Annual Precipitation | 8.5 |
| Average Annual Snowfall | 21.9 |
Average High
Days of Rain
Source: NOAA climate normals (30-year)
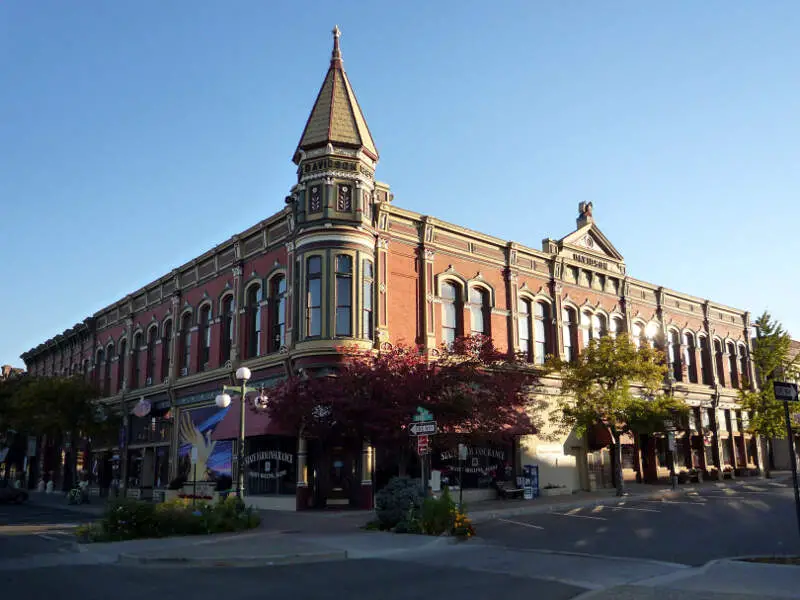
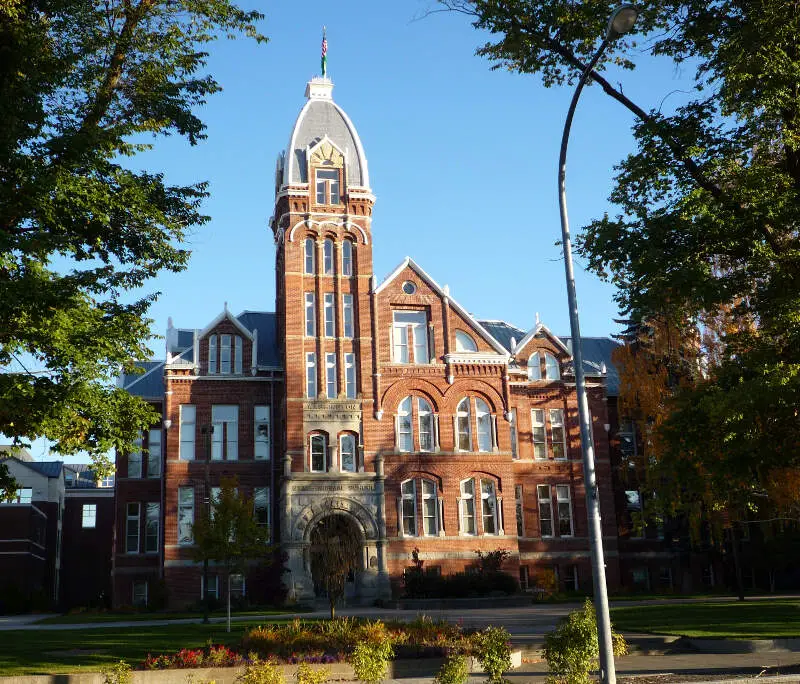
Ellensburg, WA Photos
Rankings & Articles For Ellensburg


Locations Around Ellensburg
Map Of Ellensburg, WA
Best Places Around Ellensburg
Union Gap, WA
Population 6,584
Wenatchee, WA
Population 35,484
Quincy, WA
Population 7,998
Yakima, WA
Population 96,961
Toppenish, WA
Population 8,723
Selah, WA
Population 8,437
Terrace Heights, WA
Population 10,041
East Wenatchee, WA
Population 14,199
Ellensburg Demographics And Statistics
Population over time in Ellensburg
The current population in Ellensburg is 20,874. The population has increased 17.0% from 2010.
| Year | Population | % Change |
|---|---|---|
| 2024 | 20,874 | 10.4% |
| 2023 | 18,913 | -0.5% |
| 2022 | 19,003 | -1.1% |
| 2021 | 19,215 | -7.1% |
| 2020 | 20,679 | 2.5% |
| 2019 | 20,167 | 1.9% |
| 2018 | 19,799 | 2.5% |
| 2017 | 19,307 | 1.8% |
| 2016 | 18,957 | 1.7% |
| 2015 | 18,637 | 1.0% |
| 2014 | 18,455 | 0.8% |
| 2013 | 18,312 | 0.6% |
| 2012 | 18,204 | 0.9% |
| 2011 | 18,039 | 1.1% |
| 2010 | 17,847 | - |
Race / Ethnicity in Ellensburg
See the full breakdown
Ellensburg is:
75.8% White with 15,813 White residents.
2.1% African American with 431 African American residents.
0.2% American Indian with 48 American Indian residents.
2.6% Asian with 550 Asian residents.
0.0% Hawaiian with 2 Hawaiian residents.
0.0% Other with 0 Other residents.
6.5% Two Or More with 1,356 Two Or More residents.
12.8% Hispanic with 2,674 Hispanic residents.
| Race | Ellensburg | WA | USA |
|---|---|---|---|
| White | 75.8% | 63.1% | 57.4% |
| African American | 2.1% | 3.8% | 11.9% |
| American Indian | 0.2% | 0.8% | 0.5% |
| Asian | 2.6% | 9.7% | 5.9% |
| Hawaiian | 0.0% | 0.7% | 0.2% |
| Other | 0.0% | 0.6% | 0.6% |
| Two Or More | 6.5% | 6.8% | 4.3% |
| Hispanic | 12.8% | 14.4% | 19.3% |
Gender in Ellensburg
See the full breakdown
Ellensburg is 52.6% female with 10,988 female residents.
Ellensburg is 47.4% male with 9,886 male residents.
| Gender | Ellensburg | WA | USA |
|---|---|---|---|
| Female | 52.6% | 49.6% | 50.5% |
| Male | 47.4% | 50.4% | 49.5% |
Highest level of educational attainment in Ellensburg for adults over 25
See the full breakdown
2.0% of adults in Ellensburg completed < 9th grade.
4.0% of adults in Ellensburg completed 9-12th grade.
21.0% of adults in Ellensburg completed high school / ged.
23.0% of adults in Ellensburg completed some college.
9.0% of adults in Ellensburg completed associate's degree.
23.0% of adults in Ellensburg completed bachelor's degree.
13.0% of adults in Ellensburg completed master's degree.
2.0% of adults in Ellensburg completed professional degree.
3.0% of adults in Ellensburg completed doctorate degree.
| Education | Ellensburg | WA | USA |
|---|---|---|---|
| < 9th Grade | 2.0% | 4.0% | 4.0% |
| 9-12th Grade | 4.0% | 4.0% | 6.0% |
| High School / GED | 21.0% | 22.0% | 26.0% |
| Some College | 23.0% | 21.0% | 19.0% |
| Associate's Degree | 9.0% | 10.0% | 9.0% |
| Bachelor's Degree | 23.0% | 24.0% | 22.0% |
| Master's Degree | 13.0% | 11.0% | 10.0% |
| Professional Degree | 2.0% | 2.0% | 2.0% |
| Doctorate Degree | 3.0% | 2.0% | 2.0% |
Household Income For Ellensburg, Washington
See the full breakdown
10.6% of households in Ellensburg earn Less than $10,000.
4.0% of households in Ellensburg earn $10,000 to $14,999.
9.7% of households in Ellensburg earn $15,000 to $24,999.
9.7% of households in Ellensburg earn $25,000 to $34,999.
14.1% of households in Ellensburg earn $35,000 to $49,999.
14.8% of households in Ellensburg earn $50,000 to $74,999.
10.9% of households in Ellensburg earn $75,000 to $99,999.
16.4% of households in Ellensburg earn $100,000 to $149,999.
6.5% of households in Ellensburg earn $150,000 to $199,999.
3.3% of households in Ellensburg earn $200,000 or more.
| Income | Ellensburg | WA | USA |
|---|---|---|---|
| Less than $10,000 | 10.6% | 3.9% | 5.0% |
| $10,000 to $14,999 | 4.0% | 2.5% | 3.4% |
| $15,000 to $24,999 | 9.7% | 4.6% | 6.3% |
| $25,000 to $34,999 | 9.7% | 5.0% | 6.6% |
| $35,000 to $49,999 | 14.1% | 8.2% | 10.1% |
| $50,000 to $74,999 | 14.8% | 14.1% | 15.5% |
| $75,000 to $99,999 | 10.9% | 12.4% | 12.6% |
| $100,000 to $149,999 | 16.4% | 19.2% | 17.5% |
| $150,000 to $199,999 | 6.5% | 11.4% | 9.6% |
| $200,000 or more | 3.3% | 18.5% | 13.4% |
Source: U.S. Census ACS 5-year estimates (2024)


