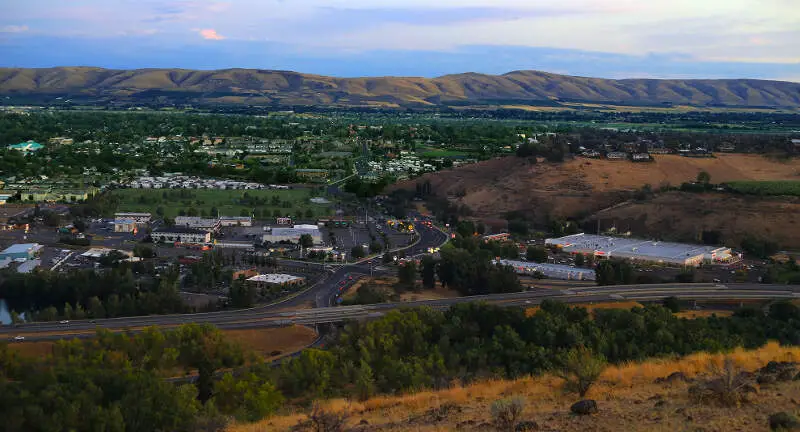
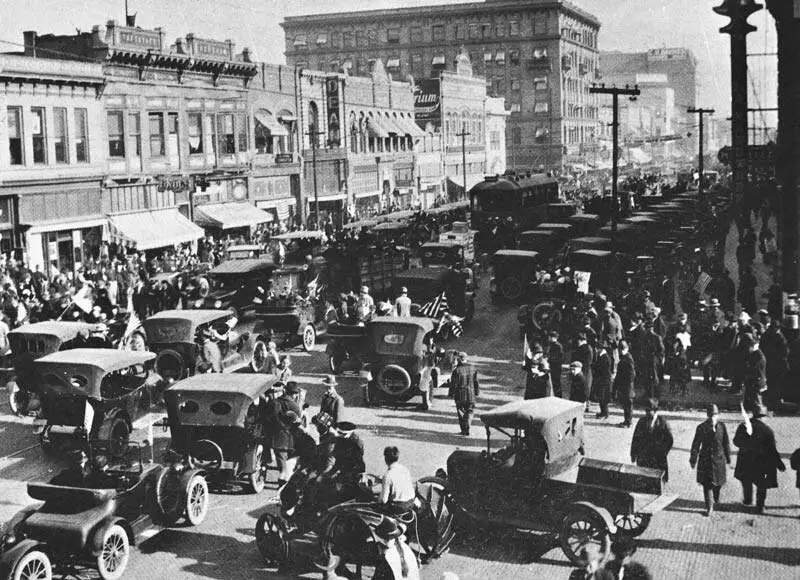
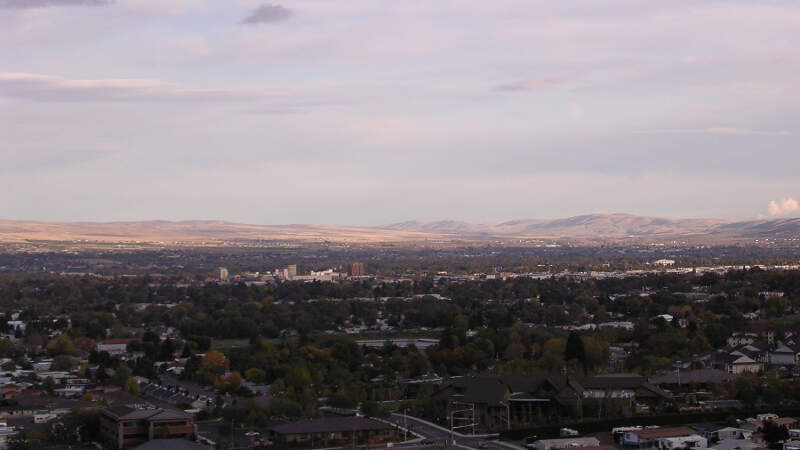
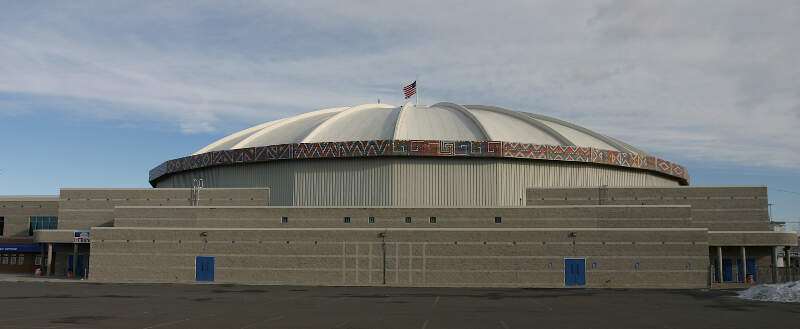
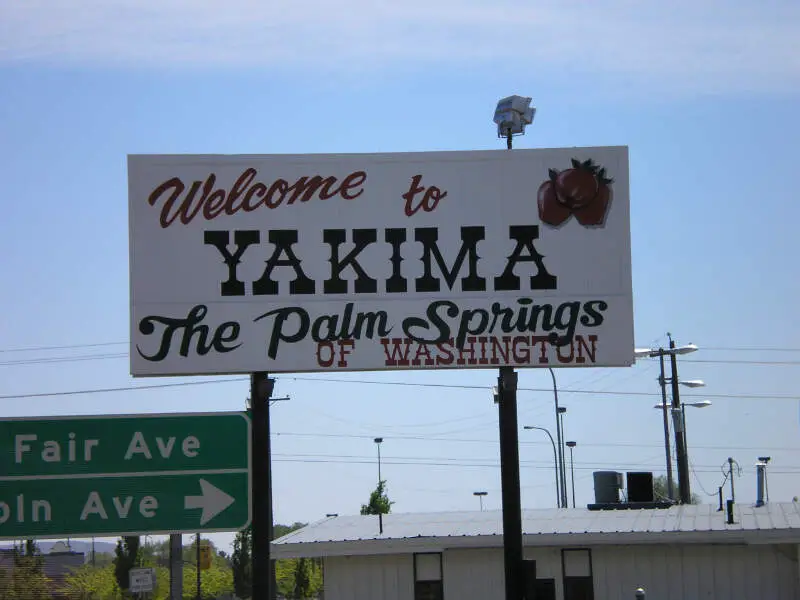
Yakima, WA
Demographics And Statistics
Living In Yakima, Washington Summary
Life in Yakima research summary. HomeSnacks has been using Saturday Night Science to research the quality of life in Yakima over the past nine years using Census, FBI, Zillow, and other primary data sources. Based on the most recently available data, we found the following about life in Yakima:
The population in Yakima is 96,810.
The median home value in Yakima is $355,584.
The median income in Yakima is $59,228.
The cost of living in Yakima is 100 which is 1.0x lower than the national average.
The median rent in Yakima is $1,075.
The unemployment rate in Yakima is 8.0%.
The poverty rate in Yakima is 17.0%.
The average high in Yakima is 63.0° and the average low is 37.9°.
Yakima SnackAbility
Overall SnackAbility
Yakima, WA Crime Report
Crime in Yakima summary. We use data from the FBI to determine the crime rates in Yakima. Key points include:
There were 2,502 total crimes in Yakima in the last reporting year.
The overall crime rate per 100,000 people in Yakima is 2,588.8 / 100k people.
The violent crime rate per 100,000 people in Yakima is 544.3 / 100k people.
The property crime rate per 100,000 people in Yakima is 2,044.6 / 100k people.
Overall, crime in Yakima is 22.16% above the national average.
Total Crimes
Above National Average
Crime In Yakima Comparison Table
| Statistic | Count Raw |
Yakima / 100k People |
Washington / 100k People |
National / 100k People |
|---|---|---|---|---|
| Total Crimes Per 100K | 2,502 | 2,588.8 | 2,792.6 | 2,119.2 |
| Violent Crime | 526 | 544.3 | 326.1 | 359.0 |
| Murder | 15 | 15.5 | 3.8 | 5.0 |
| Robbery | 57 | 59.0 | 67.5 | 61.0 |
| Aggravated Assault | 418 | 432.5 | 217.0 | 256.0 |
| Property Crime | 1,976 | 2,044.6 | 2,466.5 | 1,760.0 |
| Burglary | 343 | 354.9 | 398.8 | 229.0 |
| Larceny | 1,364 | 1,411.3 | 1,634.2 | 1,272.0 |
| Car Theft | 269 | 278.3 | 433.5 | 259.0 |
Yakima, WA Cost Of Living
Cost of living in Yakima summary. We use data on the cost of living to determine how expensive it is to live in Yakima. Real estate prices drive most of the variance in cost of living around Washington. Key points include:
The cost of living in Yakima is 100 with 100 being average.
The cost of living in Yakima is 1.0x lower than the national average.
The median home value in Yakima is $355,584.
The median income in Yakima is $59,228.
Yakima's Overall Cost Of Living
Lower Than The National Average
Cost Of Living In Yakima Comparison Table
| Living Expense | Yakima | Washington | National Average | |
|---|---|---|---|---|
| Overall | 100 | 118 | 100 | |
| Services | 101 | 111 | 100 | |
| Groceries | 106 | 112 | 100 | |
| Health | 114 | 122 | 100 | |
| Housing | 98 | 135 | 100 | |
| Transportation | 116 | 124 | 100 | |
| Utilities | 91 | 91 | 100 | |
Yakima, WA Weather
The average high in Yakima is 63.0° and the average low is 37.9°.
There are 26.2 days of precipitation each year.
Expect an average of 9.0 inches of precipitation each year with 20.2 inches of snow.
| Stat | Yakima |
|---|---|
| Average Annual High | 63.0 |
| Average Annual Low | 37.9 |
| Annual Precipitation Days | 26.2 |
| Average Annual Precipitation | 9.0 |
| Average Annual Snowfall | 20.2 |
Average High
Days of Rain
Yakima, WA Photos
7 Reviews & Comments About Yakima
/5

Cheeseburger Eddy - None
I was born in Yakima, and live there now. I have no problem saying it is a s**t hole dangerous town.
I have been shot at, had a gun pointed at me by someone driving by, as I was walking down the street, and about 7 years ago when I was 21 years old, my friends at the time decided to bring me to a party, and we had already been drinking prior to going, and I was pretty hammered
Well it turns out it was a I believe Norteno, gang party, and they were partying for the reunion of a fellow gang members death. I said something that offended ALL of them, but it wasn't anything horrible, and about 7 to 10 of them pulled out their fire arms which all had laser sights, and my friend said I had a bunch of red dots on my face, and chest.
Luckily my friend stepped in front of me with his hands up telling them I was very intoxicated, apologizing to them all. I know that sort of thing can happen just about anywhere, but that's just the tip of the iceberg of the things I've seen here.
There's tons of prostitution, drug dealing, and yeah gangs. I'm aiming to get the h**l out of yakima asap. Don't go there if you don't absolutely have too.
Mauro Silva - None
Lol I've lived in Yakima forever it isn't even that bad t
Bailey Volin - None
Listen here buddy I live in Yakima it is not that bad.
Alien Gacha - None
i live in yakima there is so much pools here and resturants
cock man - None
i live in crackima so yea i kn ow it s***s
Tink Poirier - None
I live in Yakima and there are no stabbings only shootings
HomeSnacks User - None
I moved from Yakima to Spokane...went back for a visit, is never happening again.
Spokane at least keeps the druggies, car thefts, crime, and poverty to Felonie Flats" otherwise known as the "West Side".
When I left yakima, there was "the hole" now the whole city is one."
Rankings for Yakima in Washington


Locations Around Yakima
Map Of Yakima, WA
Best Places Around Yakima
Union Gap, WA
Population 6,511
Sunnyside, WA
Population 16,329
Grandview, WA
Population 11,042
Ellensburg, WA
Population 18,913
Toppenish, WA
Population 8,746
Selah, WA
Population 8,301
Terrace Heights, WA
Population 9,480
Yakima Demographics And Statistics
Population over time in Yakima
The current population in Yakima is 96,810. The population has increased 9.2% from 2010.
| Year | Population | % Change |
|---|---|---|
| 2023 | 96,810 | 0.0% |
| 2022 | 96,764 | 0.5% |
| 2021 | 96,266 | 2.6% |
| 2020 | 93,829 | 0.4% |
| 2019 | 93,413 | -0.0% |
| 2018 | 93,416 | 0.3% |
| 2017 | 93,182 | -0.2% |
| 2016 | 93,338 | 0.1% |
| 2015 | 93,261 | 0.5% |
| 2014 | 92,806 | 0.8% |
| 2013 | 92,082 | 1.1% |
| 2012 | 91,083 | 1.4% |
| 2011 | 89,825 | 1.3% |
| 2010 | 88,630 | - |
Race / Ethnicity in Yakima
Yakima is:
43.7% White with 42,345 White residents.
1.4% African American with 1,389 African American residents.
0.8% American Indian with 742 American Indian residents.
1.4% Asian with 1,372 Asian residents.
0.8% Hawaiian with 780 Hawaiian residents.
0.5% Other with 468 Other residents.
3.8% Two Or More with 3,665 Two Or More residents.
47.6% Hispanic with 46,049 Hispanic residents.
| Race | Yakima | WA | USA |
|---|---|---|---|
| White | 43.7% | 64.3% | 58.2% |
| African American | 1.4% | 3.8% | 12.0% |
| American Indian | 0.8% | 0.8% | 0.5% |
| Asian | 1.4% | 9.3% | 5.7% |
| Hawaiian | 0.8% | 0.7% | 0.2% |
| Other | 0.5% | 0.5% | 0.5% |
| Two Or More | 3.8% | 6.5% | 3.9% |
| Hispanic | 47.6% | 14.1% | 19.0% |
Gender in Yakima
Yakima is 50.1% female with 48,507 female residents.
Yakima is 49.9% male with 48,303 male residents.
| Gender | Yakima | WA | USA |
|---|---|---|---|
| Female | 50.1% | 49.6% | 50.5% |
| Male | 49.9% | 50.4% | 49.5% |
Highest level of educational attainment in Yakima for adults over 25
12.0% of adults in Yakima completed < 9th grade.
10.0% of adults in Yakima completed 9-12th grade.
28.0% of adults in Yakima completed high school / ged.
22.0% of adults in Yakima completed some college.
8.0% of adults in Yakima completed associate's degree.
13.0% of adults in Yakima completed bachelor's degree.
5.0% of adults in Yakima completed master's degree.
1.0% of adults in Yakima completed professional degree.
1.0% of adults in Yakima completed doctorate degree.
| Education | Yakima | WA | USA |
|---|---|---|---|
| < 9th Grade | 12.0% | 3.0% | 5.0% |
| 9-12th Grade | 10.0% | 4.0% | 6.0% |
| High School / GED | 28.0% | 22.0% | 26.0% |
| Some College | 22.0% | 22.0% | 19.0% |
| Associate's Degree | 8.0% | 10.0% | 9.0% |
| Bachelor's Degree | 13.0% | 24.0% | 21.0% |
| Master's Degree | 5.0% | 11.0% | 10.0% |
| Professional Degree | 1.0% | 2.0% | 2.0% |
| Doctorate Degree | 1.0% | 2.0% | 2.0% |
Household Income For Yakima, Washington
3.1% of households in Yakima earn Less than $10,000.
5.3% of households in Yakima earn $10,000 to $14,999.
8.8% of households in Yakima earn $15,000 to $24,999.
8.8% of households in Yakima earn $25,000 to $34,999.
15.8% of households in Yakima earn $35,000 to $49,999.
18.4% of households in Yakima earn $50,000 to $74,999.
14.4% of households in Yakima earn $75,000 to $99,999.
14.1% of households in Yakima earn $100,000 to $149,999.
6.7% of households in Yakima earn $150,000 to $199,999.
4.6% of households in Yakima earn $200,000 or more.
| Income | Yakima | WA | USA |
|---|---|---|---|
| Less than $10,000 | 3.1% | 3.8% | 4.9% |
| $10,000 to $14,999 | 5.3% | 2.7% | 3.6% |
| $15,000 to $24,999 | 8.8% | 4.9% | 6.6% |
| $25,000 to $34,999 | 8.8% | 5.3% | 6.8% |
| $35,000 to $49,999 | 15.8% | 8.6% | 10.4% |
| $50,000 to $74,999 | 18.4% | 14.6% | 15.7% |
| $75,000 to $99,999 | 14.4% | 12.6% | 12.7% |
| $100,000 to $149,999 | 14.1% | 19.2% | 17.4% |
| $150,000 to $199,999 | 6.7% | 11.3% | 9.3% |
| $200,000 or more | 4.6% | 17.2% | 12.6% |


