Ellensburg, WA
Demographics And Statistics
Living In Ellensburg, Washington Summary
Life in Ellensburg research summary. HomeSnacks has been using Saturday Night Science to research the quality of life in Ellensburg over the past nine years using Census, FBI, Zillow, and other primary data sources. Based on the most recently available data, we found the following about life in Ellensburg:
The population in Ellensburg is 18,913.
The median home value in Ellensburg is $453,132.
The median income in Ellensburg is $49,888.
The cost of living in Ellensburg is 108 which is 1.1x higher than the national average.
The median rent in Ellensburg is $1,258.
The unemployment rate in Ellensburg is 7.6%.
The poverty rate in Ellensburg is 21.0%.
The average high in Ellensburg is 60.3° and the average low is 37.0°.
Ellensburg SnackAbility
Overall SnackAbility
Ellensburg, WA Crime Report
Crime in Ellensburg summary. We use data from the FBI to determine the crime rates in Ellensburg. Key points include:
There were 445 total crimes in Ellensburg in the last reporting year.
The overall crime rate per 100,000 people in Ellensburg is 2,409.1 / 100k people.
The violent crime rate per 100,000 people in Ellensburg is 227.4 / 100k people.
The property crime rate per 100,000 people in Ellensburg is 2,181.7 / 100k people.
Overall, crime in Ellensburg is 13.68% above the national average.
Total Crimes
Above National Average
Crime In Ellensburg Comparison Table
| Statistic | Count Raw | Ellensburg / 100k People | Washington / 100k People | National / 100k People |
|---|---|---|---|---|
| Total Crimes Per 100K | 445 | 2,409.1 | 2,792.6 | 2,119.2 |
| Violent Crime | 42 | 227.4 | 326.1 | 359.0 |
| Murder | 1 | 5.4 | 3.8 | 5.0 |
| Robbery | 4 | 21.7 | 67.5 | 61.0 |
| Aggravated Assault | 20 | 108.3 | 217.0 | 256.0 |
| Property Crime | 403 | 2,181.7 | 2,466.5 | 1,760.0 |
| Burglary | 45 | 243.6 | 398.8 | 229.0 |
| Larceny | 343 | 1,856.9 | 1,634.2 | 1,272.0 |
| Car Theft | 15 | 81.2 | 433.5 | 259.0 |
Ellensburg, WA Cost Of Living
Cost of living in Ellensburg summary. We use data on the cost of living to determine how expensive it is to live in Ellensburg. Real estate prices drive most of the variance in cost of living around Washington. Key points include:
The cost of living in Ellensburg is 108 with 100 being average.
The cost of living in Ellensburg is 1.1x higher than the national average.
The median home value in Ellensburg is $453,132.
The median income in Ellensburg is $49,888.
Ellensburg's Overall Cost Of Living
Higher Than The National Average
Cost Of Living In Ellensburg Comparison Table
| Living Expense | Ellensburg | Washington | National Average | |
|---|---|---|---|---|
| Overall | 108 | 118 | 100 | |
| Services | 102 | 111 | 100 | |
| Groceries | 103 | 112 | 100 | |
| Health | 113 | 122 | 100 | |
| Housing | 122 | 135 | 100 | |
| Transportation | 117 | 124 | 100 | |
| Utilities | 94 | 91 | 100 | |
Ellensburg, WA Weather
The average high in Ellensburg is 60.3° and the average low is 37.0°.
There are 29.1 days of precipitation each year.
Expect an average of 8.5 inches of precipitation each year with 21.9 inches of snow.
| Stat | Ellensburg |
|---|---|
| Average Annual High | 60.3 |
| Average Annual Low | 37.0 |
| Annual Precipitation Days | 29.1 |
| Average Annual Precipitation | 8.5 |
| Average Annual Snowfall | 21.9 |
Average High
Days of Rain
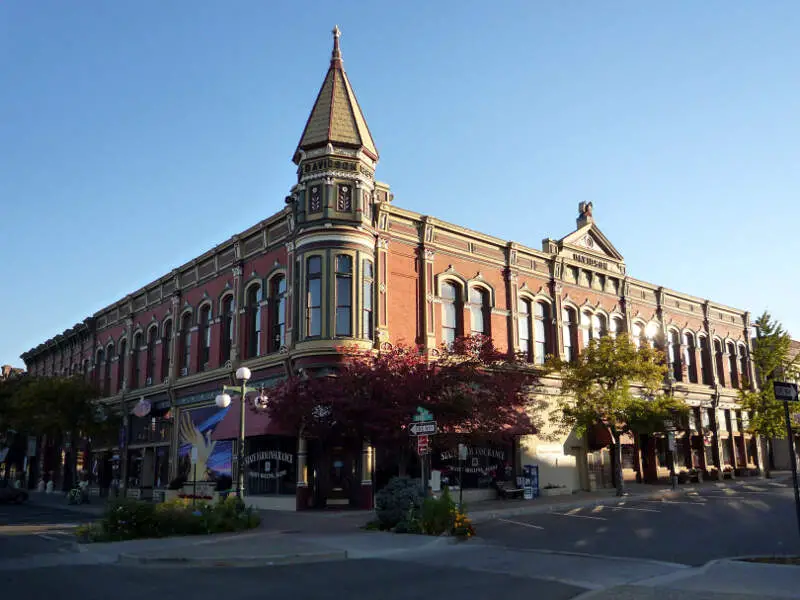
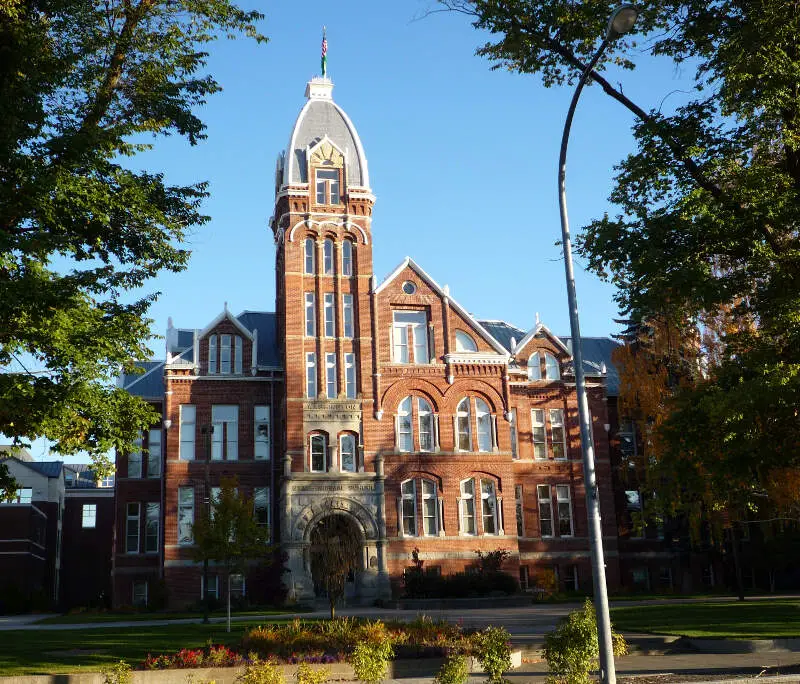
Ellensburg, WA Photos
Rankings for Ellensburg in Washington


Locations Around Ellensburg
Map Of Ellensburg, WA
Best Places Around Ellensburg
Union Gap, WA
Population 6,511
Wenatchee, WA
Population 35,502
Quincy, WA
Population 7,922
Yakima, WA
Population 96,810
Toppenish, WA
Population 8,746
Selah, WA
Population 8,301
Terrace Heights, WA
Population 9,480
East Wenatchee, WA
Population 14,114
Ellensburg Demographics And Statistics
Population over time in Ellensburg
The current population in Ellensburg is 18,913. The population has increased 6.0% from 2010.
| Year | Population | % Change |
|---|---|---|
| 2023 | 18,913 | -0.5% |
| 2022 | 19,003 | -1.1% |
| 2021 | 19,215 | -7.1% |
| 2020 | 20,679 | 2.5% |
| 2019 | 20,167 | 1.9% |
| 2018 | 19,799 | 2.5% |
| 2017 | 19,307 | 1.8% |
| 2016 | 18,957 | 1.7% |
| 2015 | 18,637 | 1.0% |
| 2014 | 18,455 | 0.8% |
| 2013 | 18,312 | 0.6% |
| 2012 | 18,204 | 0.9% |
| 2011 | 18,039 | 1.1% |
| 2010 | 17,847 | - |
Race / Ethnicity in Ellensburg
Ellensburg is:
75.1% White with 14,210 White residents.
1.8% African American with 339 African American residents.
0.4% American Indian with 70 American Indian residents.
3.1% Asian with 586 Asian residents.
0.2% Hawaiian with 42 Hawaiian residents.
0.0% Other with 0 Other residents.
6.3% Two Or More with 1,184 Two Or More residents.
13.1% Hispanic with 2,482 Hispanic residents.
| Race | Ellensburg | WA | USA |
|---|---|---|---|
| White | 75.1% | 64.3% | 58.2% |
| African American | 1.8% | 3.8% | 12.0% |
| American Indian | 0.4% | 0.8% | 0.5% |
| Asian | 3.1% | 9.3% | 5.7% |
| Hawaiian | 0.2% | 0.7% | 0.2% |
| Other | 0.0% | 0.5% | 0.5% |
| Two Or More | 6.3% | 6.5% | 3.9% |
| Hispanic | 13.1% | 14.1% | 19.0% |
Gender in Ellensburg
Ellensburg is 51.3% female with 9,708 female residents.
Ellensburg is 48.7% male with 9,205 male residents.
| Gender | Ellensburg | WA | USA |
|---|---|---|---|
| Female | 51.3% | 49.6% | 50.5% |
| Male | 48.7% | 50.4% | 49.5% |
Highest level of educational attainment in Ellensburg for adults over 25
1.0% of adults in Ellensburg completed < 9th grade.
5.0% of adults in Ellensburg completed 9-12th grade.
23.0% of adults in Ellensburg completed high school / ged.
20.0% of adults in Ellensburg completed some college.
10.0% of adults in Ellensburg completed associate's degree.
23.0% of adults in Ellensburg completed bachelor's degree.
13.0% of adults in Ellensburg completed master's degree.
2.0% of adults in Ellensburg completed professional degree.
3.0% of adults in Ellensburg completed doctorate degree.
| Education | Ellensburg | WA | USA |
|---|---|---|---|
| < 9th Grade | 1.0% | 3.0% | 5.0% |
| 9-12th Grade | 5.0% | 4.0% | 6.0% |
| High School / GED | 23.0% | 22.0% | 26.0% |
| Some College | 20.0% | 22.0% | 19.0% |
| Associate's Degree | 10.0% | 10.0% | 9.0% |
| Bachelor's Degree | 23.0% | 24.0% | 21.0% |
| Master's Degree | 13.0% | 11.0% | 10.0% |
| Professional Degree | 2.0% | 2.0% | 2.0% |
| Doctorate Degree | 3.0% | 2.0% | 2.0% |
Household Income For Ellensburg, Washington
10.7% of households in Ellensburg earn Less than $10,000.
5.8% of households in Ellensburg earn $10,000 to $14,999.
9.5% of households in Ellensburg earn $15,000 to $24,999.
9.5% of households in Ellensburg earn $25,000 to $34,999.
14.7% of households in Ellensburg earn $35,000 to $49,999.
14.8% of households in Ellensburg earn $50,000 to $74,999.
11.1% of households in Ellensburg earn $75,000 to $99,999.
14.0% of households in Ellensburg earn $100,000 to $149,999.
7.5% of households in Ellensburg earn $150,000 to $199,999.
2.6% of households in Ellensburg earn $200,000 or more.
| Income | Ellensburg | WA | USA |
|---|---|---|---|
| Less than $10,000 | 10.7% | 3.8% | 4.9% |
| $10,000 to $14,999 | 5.8% | 2.7% | 3.6% |
| $15,000 to $24,999 | 9.5% | 4.9% | 6.6% |
| $25,000 to $34,999 | 9.5% | 5.3% | 6.8% |
| $35,000 to $49,999 | 14.7% | 8.6% | 10.4% |
| $50,000 to $74,999 | 14.8% | 14.6% | 15.7% |
| $75,000 to $99,999 | 11.1% | 12.6% | 12.7% |
| $100,000 to $149,999 | 14.0% | 19.2% | 17.4% |
| $150,000 to $199,999 | 7.5% | 11.3% | 9.3% |
| $200,000 or more | 2.6% | 17.2% | 12.6% |


