Arlington SnackAbility
Overall SnackAbility
Crime in Arlington summary. We use data from the FBI to determine the crime rates in Arlington. Key points include:
There were 553 total crimes in Arlington in the last reporting year.
The overall crime rate per 100,000 people in Arlington is 2,559.0 / 100k people.
The violent crime rate per 100,000 people in Arlington is 337.8 / 100k people.
The property crime rate per 100,000 people in Arlington is 2,221.2 / 100k people.
Overall, crime in Arlington is 20.75% above the national average.
Total Crimes
Above National Average
Crime In Arlington Comparison Table
| Statistic | Count Raw |
Arlington / 100k People |
Washington / 100k People |
National / 100k People |
|---|---|---|---|---|
| Total Crimes Per 100K | 553 | 2,559.0 | 2,792.6 | 2,119.2 |
| Violent Crime | 73 | 337.8 | 326.1 | 359.0 |
| Murder | 2 | 9.3 | 3.8 | 5.0 |
| Robbery | 14 | 64.8 | 67.5 | 61.0 |
| Aggravated Assault | 49 | 226.7 | 217.0 | 256.0 |
| Property Crime | 480 | 2,221.2 | 2,466.5 | 1,760.0 |
| Burglary | 74 | 342.4 | 398.8 | 229.0 |
| Larceny | 314 | 1,453.0 | 1,634.2 | 1,272.0 |
| Car Theft | 92 | 425.7 | 433.5 | 259.0 |
Source: FBI Uniform Crime Reporting (2024)
Cost of living in Arlington summary. We use data on the cost of living to determine how expensive it is to live in Arlington. Real estate prices drive most of the variance in cost of living around Washington. Key points include:
The cost of living in Arlington is 129 with 100 being average.
The cost of living in Arlington is 1.3x higher than the national average.
The median home value in Arlington is $669,005.
The median income in Arlington is $88,231.
Arlington's Overall Cost Of Living
Higher Than The National Average
Cost Of Living In Arlington Comparison Table
| Living Expense | Arlington | Washington | National Average |
|---|---|---|---|
| Overall | 129 | 120 | 100 |
| Services | 106 | 108 | 100 |
| Groceries | 105 | 108 | 100 |
| Health | 174 | 137 | 100 |
| Housing | 112 | 111 | 100 |
| Transportation | 108 | 111 | 100 |
| Utilities | 108 | 110 | 100 |
Source: Cost of living index, normalized to US average = 100
Arlington, WA Weather
The average high in Arlington is 59.1° and the average low is 41.6°.
There are 141.5 days of precipitation each year.
Expect an average of 46.8 inches of precipitation each year with 5.5 inches of snow.
| Stat | Arlington |
|---|---|
| Average Annual High | 59.1 |
| Average Annual Low | 41.6 |
| Annual Precipitation Days | 141.5 |
| Average Annual Precipitation | 46.8 |
| Average Annual Snowfall | 5.5 |
Average High
Days of Rain
Source: NOAA climate normals (30-year)
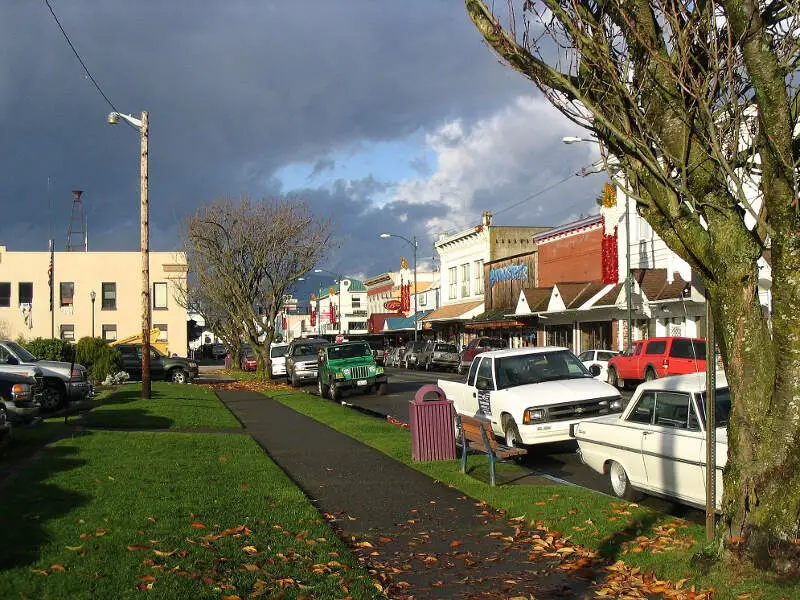
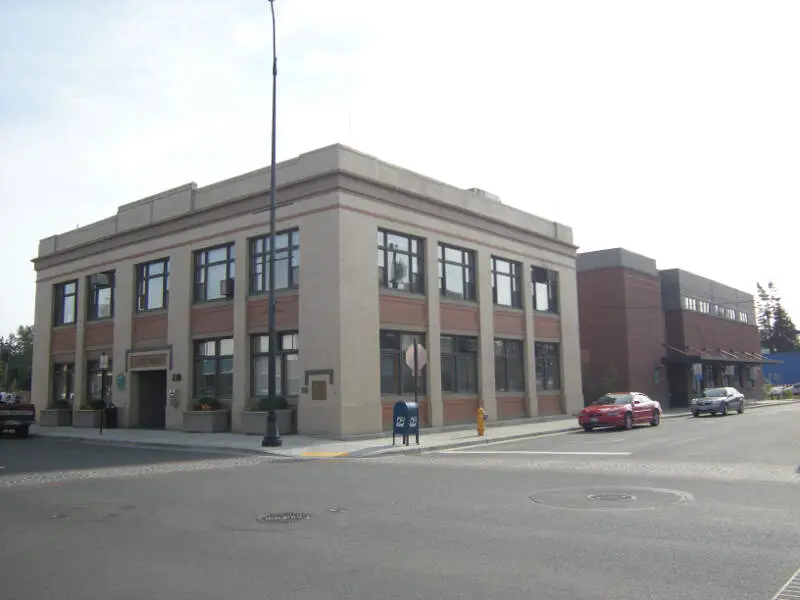
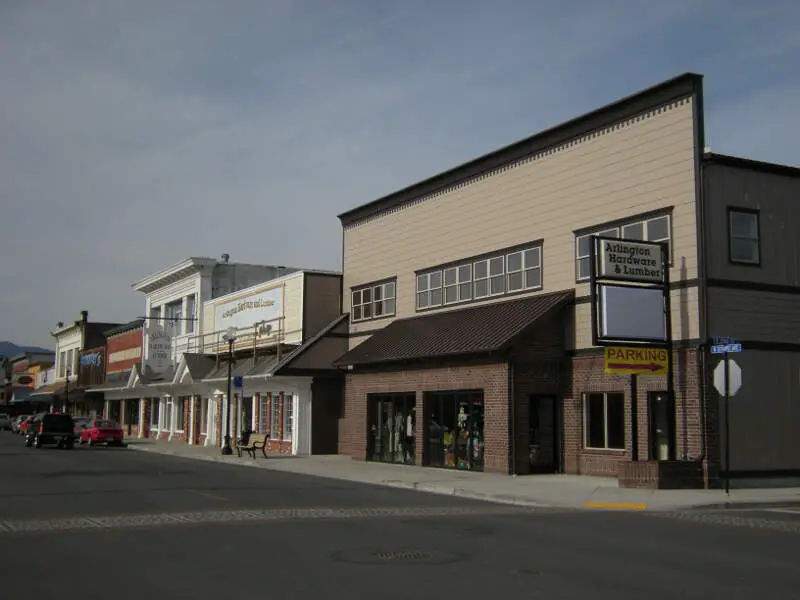
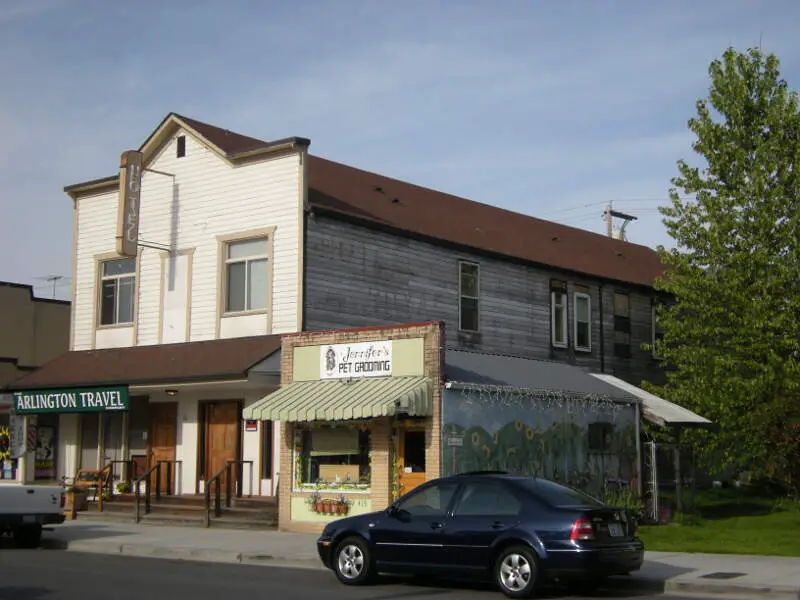
Arlington, WA Photos
Rankings & Articles For Arlington


Locations Around Arlington
Map Of Arlington, WA
Best Places Around Arlington
Snohomish, WA
Population 10,239
Mount Vernon, WA
Population 35,377
Everett, WA
Population 111,845
Lake Stevens, WA
Population 40,253
Stanwood, WA
Population 8,373
Marysville, WA
Population 73,002
Mukilteo, WA
Population 21,323
Eastmont, WA
Population 23,721
Arlington Demographics And Statistics
Population over time in Arlington
The current population in Arlington is 21,095. The population has increased 24.7% from 2010.
| Year | Population | % Change |
|---|---|---|
| 2024 | 21,095 | 2.4% |
| 2023 | 20,599 | 1.7% |
| 2022 | 20,263 | 2.2% |
| 2021 | 19,832 | -0.6% |
| 2020 | 19,947 | 2.4% |
| 2019 | 19,483 | 1.7% |
| 2018 | 19,154 | 1.4% |
| 2017 | 18,884 | 0.7% |
| 2016 | 18,749 | 0.9% |
| 2015 | 18,578 | 1.1% |
| 2014 | 18,370 | 1.3% |
| 2013 | 18,139 | 2.1% |
| 2012 | 17,773 | 2.1% |
| 2011 | 17,403 | 2.9% |
| 2010 | 16,913 | - |
Race / Ethnicity in Arlington
See the full breakdown
Arlington is:
71.4% White with 15,060 White residents.
1.4% African American with 296 African American residents.
0.2% American Indian with 40 American Indian residents.
5.4% Asian with 1,135 Asian residents.
0.2% Hawaiian with 38 Hawaiian residents.
0.6% Other with 118 Other residents.
4.9% Two Or More with 1,040 Two Or More residents.
16.0% Hispanic with 3,368 Hispanic residents.
| Race | Arlington | WA | USA |
|---|---|---|---|
| White | 71.4% | 63.1% | 57.4% |
| African American | 1.4% | 3.8% | 11.9% |
| American Indian | 0.2% | 0.8% | 0.5% |
| Asian | 5.4% | 9.7% | 5.9% |
| Hawaiian | 0.2% | 0.7% | 0.2% |
| Other | 0.6% | 0.6% | 0.6% |
| Two Or More | 4.9% | 6.8% | 4.3% |
| Hispanic | 16.0% | 14.4% | 19.3% |
Gender in Arlington
See the full breakdown
Arlington is 49.5% female with 10,440 female residents.
Arlington is 50.5% male with 10,654 male residents.
| Gender | Arlington | WA | USA |
|---|---|---|---|
| Female | 49.5% | 49.6% | 50.5% |
| Male | 50.5% | 50.4% | 49.5% |
Highest level of educational attainment in Arlington for adults over 25
See the full breakdown
3.0% of adults in Arlington completed < 9th grade.
6.0% of adults in Arlington completed 9-12th grade.
31.0% of adults in Arlington completed high school / ged.
27.0% of adults in Arlington completed some college.
12.0% of adults in Arlington completed associate's degree.
14.0% of adults in Arlington completed bachelor's degree.
6.0% of adults in Arlington completed master's degree.
0.0% of adults in Arlington completed professional degree.
1.0% of adults in Arlington completed doctorate degree.
| Education | Arlington | WA | USA |
|---|---|---|---|
| < 9th Grade | 3.0% | 4.0% | 4.0% |
| 9-12th Grade | 6.0% | 4.0% | 6.0% |
| High School / GED | 31.0% | 22.0% | 26.0% |
| Some College | 27.0% | 21.0% | 19.0% |
| Associate's Degree | 12.0% | 10.0% | 9.0% |
| Bachelor's Degree | 14.0% | 24.0% | 22.0% |
| Master's Degree | 6.0% | 11.0% | 10.0% |
| Professional Degree | 0.0% | 2.0% | 2.0% |
| Doctorate Degree | 1.0% | 2.0% | 2.0% |
Household Income For Arlington, Washington
See the full breakdown
5.3% of households in Arlington earn Less than $10,000.
2.7% of households in Arlington earn $10,000 to $14,999.
6.3% of households in Arlington earn $15,000 to $24,999.
6.3% of households in Arlington earn $25,000 to $34,999.
7.0% of households in Arlington earn $35,000 to $49,999.
12.8% of households in Arlington earn $50,000 to $74,999.
15.9% of households in Arlington earn $75,000 to $99,999.
20.7% of households in Arlington earn $100,000 to $149,999.
12.1% of households in Arlington earn $150,000 to $199,999.
10.9% of households in Arlington earn $200,000 or more.
| Income | Arlington | WA | USA |
|---|---|---|---|
| Less than $10,000 | 5.3% | 3.9% | 5.0% |
| $10,000 to $14,999 | 2.7% | 2.5% | 3.4% |
| $15,000 to $24,999 | 6.3% | 4.6% | 6.3% |
| $25,000 to $34,999 | 6.3% | 5.0% | 6.6% |
| $35,000 to $49,999 | 7.0% | 8.2% | 10.1% |
| $50,000 to $74,999 | 12.8% | 14.1% | 15.5% |
| $75,000 to $99,999 | 15.9% | 12.4% | 12.6% |
| $100,000 to $149,999 | 20.7% | 19.2% | 17.5% |
| $150,000 to $199,999 | 12.1% | 11.4% | 9.6% |
| $200,000 or more | 10.9% | 18.5% | 13.4% |
Source: U.S. Census ACS 5-year estimates (2024)


