Issaquah SnackAbility
Overall SnackAbility
Crime in Issaquah summary. We use data from the FBI to determine the crime rates in Issaquah. Key points include:
There were 1,511 total crimes in Issaquah in the last reporting year.
The overall crime rate per 100,000 people in Issaquah is 3,876.5 / 100k people.
The violent crime rate per 100,000 people in Issaquah is 107.8 / 100k people.
The property crime rate per 100,000 people in Issaquah is 3,768.8 / 100k people.
Overall, crime in Issaquah is 82.92% above the national average.
Total Crimes
Above National Average
Crime In Issaquah Comparison Table
| Statistic | Count Raw |
Issaquah / 100k People |
Washington / 100k People |
National / 100k People |
|---|---|---|---|---|
| Total Crimes Per 100K | 1,511 | 3,876.5 | 2,792.6 | 2,119.2 |
| Violent Crime | 42 | 107.8 | 326.1 | 359.0 |
| Murder | 1 | 2.6 | 3.8 | 5.0 |
| Robbery | 15 | 38.5 | 67.5 | 61.0 |
| Aggravated Assault | 16 | 41.0 | 217.0 | 256.0 |
| Property Crime | 1,469 | 3,768.8 | 2,466.5 | 1,760.0 |
| Burglary | 114 | 292.5 | 398.8 | 229.0 |
| Larceny | 1,221 | 3,132.5 | 1,634.2 | 1,272.0 |
| Car Theft | 134 | 343.8 | 433.5 | 259.0 |
Source: FBI Uniform Crime Reporting (2024)
Cost of living in Issaquah summary. We use data on the cost of living to determine how expensive it is to live in Issaquah. Real estate prices drive most of the variance in cost of living around Washington. Key points include:
The cost of living in Issaquah is 173 with 100 being average.
The cost of living in Issaquah is 1.7x higher than the national average.
The median home value in Issaquah is $1,158,594.
The median income in Issaquah is $154,669.
Issaquah's Overall Cost Of Living
Higher Than The National Average
Cost Of Living In Issaquah Comparison Table
| Living Expense | Issaquah | Washington | National Average |
|---|---|---|---|
| Overall | 173 | 120 | 100 |
| Services | 103 | 108 | 100 |
| Groceries | 109 | 108 | 100 |
| Health | 319 | 137 | 100 |
| Housing | 110 | 111 | 100 |
| Transportation | 110 | 111 | 100 |
| Utilities | 111 | 110 | 100 |
Source: Cost of living index, normalized to US average = 100
Issaquah, WA Weather
The average high in Issaquah is 59.5° and the average low is 43.0°.
There are 92.2 days of precipitation each year.
Expect an average of 49.8 inches of precipitation each year with 5.3 inches of snow.
| Stat | Issaquah |
|---|---|
| Average Annual High | 59.5 |
| Average Annual Low | 43.0 |
| Annual Precipitation Days | 92.2 |
| Average Annual Precipitation | 49.8 |
| Average Annual Snowfall | 5.3 |
Average High
Days of Rain
Source: NOAA climate normals (30-year)
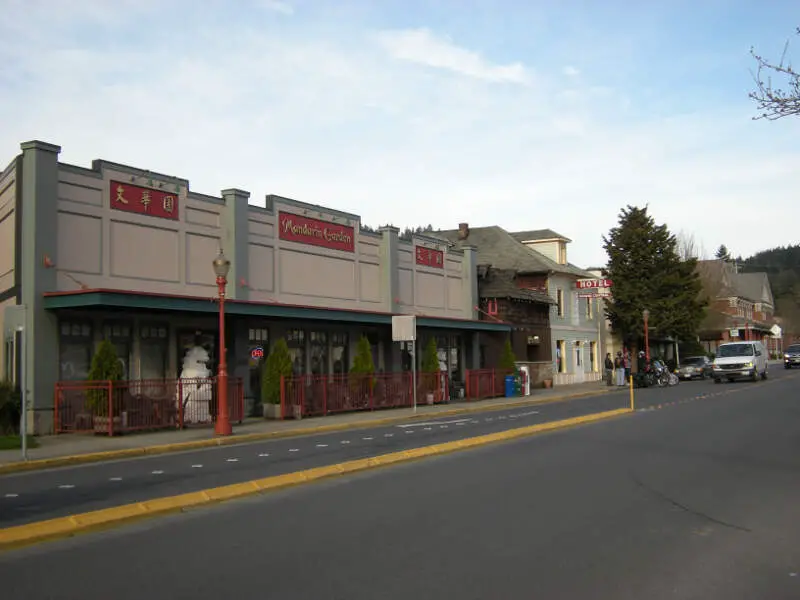
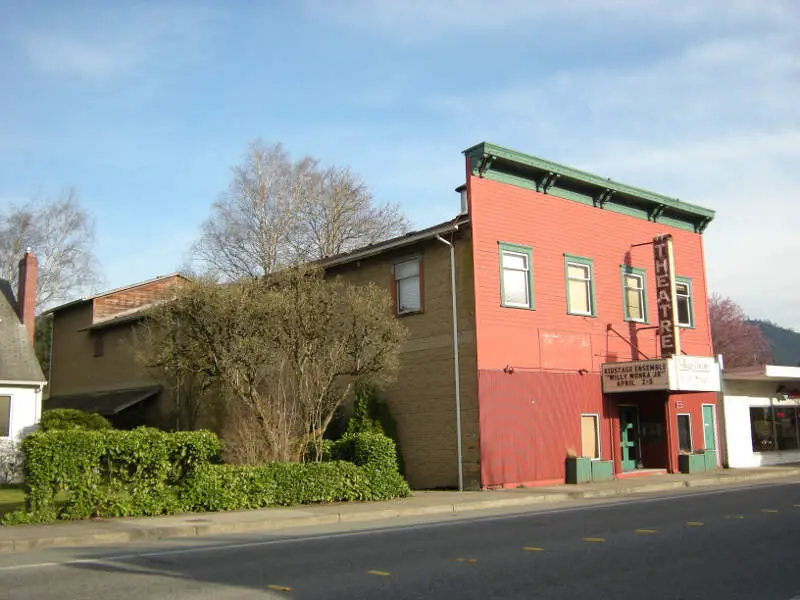
Issaquah, WA Photos


Rankings & Articles For Issaquah


Locations Around Issaquah
Map Of Issaquah, WA
Best Places Around Issaquah
SeaTac, WA
Population 32,414
Kent, WA
Population 135,603
Auburn, WA
Population 85,676
Tukwila, WA
Population 21,451
White Center, WA
Population 14,886
Bryn Mawr-Skyway, WA
Population 17,638
Des Moines, WA
Population 32,823
North Bend, WA
Population 7,953
Woodinville, WA
Population 13,438
Burien, WA
Population 51,513
Issaquah Demographics And Statistics
Population over time in Issaquah
The current population in Issaquah is 39,591. The population has increased 42.2% from 2010.
| Year | Population | % Change |
|---|---|---|
| 2024 | 39,591 | 0.3% |
| 2023 | 39,472 | 0.2% |
| 2022 | 39,400 | 0.9% |
| 2021 | 39,057 | 0.9% |
| 2020 | 38,707 | 2.0% |
| 2019 | 37,965 | 2.8% |
| 2018 | 36,938 | 3.7% |
| 2017 | 35,629 | 2.6% |
| 2016 | 34,728 | 3.1% |
| 2015 | 33,682 | 3.5% |
| 2014 | 32,551 | 3.0% |
| 2013 | 31,607 | 3.7% |
| 2012 | 30,473 | 5.0% |
| 2011 | 29,025 | 4.3% |
| 2010 | 27,838 | - |
Race / Ethnicity in Issaquah
See the full breakdown
Issaquah is:
55.7% White with 22,070 White residents.
2.2% African American with 887 African American residents.
0.2% American Indian with 73 American Indian residents.
26.6% Asian with 10,538 Asian residents.
0.3% Hawaiian with 133 Hawaiian residents.
1.1% Other with 449 Other residents.
8.1% Two Or More with 3,197 Two Or More residents.
5.7% Hispanic with 2,244 Hispanic residents.
| Race | Issaquah | WA | USA |
|---|---|---|---|
| White | 55.7% | 63.1% | 57.4% |
| African American | 2.2% | 3.8% | 11.9% |
| American Indian | 0.2% | 0.8% | 0.5% |
| Asian | 26.6% | 9.7% | 5.9% |
| Hawaiian | 0.3% | 0.7% | 0.2% |
| Other | 1.1% | 0.6% | 0.6% |
| Two Or More | 8.1% | 6.8% | 4.3% |
| Hispanic | 5.7% | 14.4% | 19.3% |
Gender in Issaquah
See the full breakdown
Issaquah is 51.5% female with 20,409 female residents.
Issaquah is 48.5% male with 19,181 male residents.
| Gender | Issaquah | WA | USA |
|---|---|---|---|
| Female | 51.5% | 49.6% | 50.5% |
| Male | 48.5% | 50.4% | 49.5% |
Highest level of educational attainment in Issaquah for adults over 25
See the full breakdown
1.0% of adults in Issaquah completed < 9th grade.
1.0% of adults in Issaquah completed 9-12th grade.
7.0% of adults in Issaquah completed high school / ged.
13.0% of adults in Issaquah completed some college.
7.0% of adults in Issaquah completed associate's degree.
39.0% of adults in Issaquah completed bachelor's degree.
24.0% of adults in Issaquah completed master's degree.
4.0% of adults in Issaquah completed professional degree.
4.0% of adults in Issaquah completed doctorate degree.
| Education | Issaquah | WA | USA |
|---|---|---|---|
| < 9th Grade | 1.0% | 4.0% | 4.0% |
| 9-12th Grade | 1.0% | 4.0% | 6.0% |
| High School / GED | 7.0% | 22.0% | 26.0% |
| Some College | 13.0% | 21.0% | 19.0% |
| Associate's Degree | 7.0% | 10.0% | 9.0% |
| Bachelor's Degree | 39.0% | 24.0% | 22.0% |
| Master's Degree | 24.0% | 11.0% | 10.0% |
| Professional Degree | 4.0% | 2.0% | 2.0% |
| Doctorate Degree | 4.0% | 2.0% | 2.0% |
Household Income For Issaquah, Washington
See the full breakdown
4.0% of households in Issaquah earn Less than $10,000.
1.1% of households in Issaquah earn $10,000 to $14,999.
3.2% of households in Issaquah earn $15,000 to $24,999.
2.3% of households in Issaquah earn $25,000 to $34,999.
3.4% of households in Issaquah earn $35,000 to $49,999.
10.6% of households in Issaquah earn $50,000 to $74,999.
7.2% of households in Issaquah earn $75,000 to $99,999.
17.3% of households in Issaquah earn $100,000 to $149,999.
13.6% of households in Issaquah earn $150,000 to $199,999.
37.4% of households in Issaquah earn $200,000 or more.
| Income | Issaquah | WA | USA |
|---|---|---|---|
| Less than $10,000 | 4.0% | 3.9% | 5.0% |
| $10,000 to $14,999 | 1.1% | 2.5% | 3.4% |
| $15,000 to $24,999 | 3.2% | 4.6% | 6.3% |
| $25,000 to $34,999 | 2.3% | 5.0% | 6.6% |
| $35,000 to $49,999 | 3.4% | 8.2% | 10.1% |
| $50,000 to $74,999 | 10.6% | 14.1% | 15.5% |
| $75,000 to $99,999 | 7.2% | 12.4% | 12.6% |
| $100,000 to $149,999 | 17.3% | 19.2% | 17.5% |
| $150,000 to $199,999 | 13.6% | 11.4% | 9.6% |
| $200,000 or more | 37.4% | 18.5% | 13.4% |
Source: U.S. Census ACS 5-year estimates (2024)


