North Bend SnackAbility
Overall SnackAbility
Crime in North Bend summary. We use data from the FBI to determine the crime rates in North Bend. Key points include:
There were 214 total crimes in North Bend in the last reporting year.
The overall crime rate per 100,000 people in North Bend is 2,505.9 / 100k people.
The violent crime rate per 100,000 people in North Bend is 82.0 / 100k people.
The property crime rate per 100,000 people in North Bend is 2,423.9 / 100k people.
Overall, crime in North Bend is 18.24% above the national average.
Total Crimes
Above National Average
Crime In North Bend Comparison Table
| Statistic | Count Raw |
North Bend / 100k People |
Washington / 100k People |
National / 100k People |
|---|---|---|---|---|
| Total Crimes Per 100K | 214 | 2,505.9 | 2,792.6 | 2,119.2 |
| Violent Crime | 7 | 82.0 | 326.1 | 359.0 |
| Murder | 1 | 11.7 | 3.8 | 5.0 |
| Robbery | 1 | 11.7 | 67.5 | 61.0 |
| Aggravated Assault | 3 | 35.1 | 217.0 | 256.0 |
| Property Crime | 207 | 2,423.9 | 2,466.5 | 1,760.0 |
| Burglary | 25 | 292.7 | 398.8 | 229.0 |
| Larceny | 166 | 1,943.8 | 1,634.2 | 1,272.0 |
| Car Theft | 16 | 187.4 | 433.5 | 259.0 |
Source: FBI Uniform Crime Reporting (2024)
Cost of living in North Bend summary. We use data on the cost of living to determine how expensive it is to live in North Bend. Real estate prices drive most of the variance in cost of living around Washington. Key points include:
The cost of living in North Bend is 161 with 100 being average.
The cost of living in North Bend is 1.6x higher than the national average.
The median home value in North Bend is $1,008,581.
The median income in North Bend is $175,109.
North Bend's Overall Cost Of Living
Higher Than The National Average
Cost Of Living In North Bend Comparison Table
| Living Expense | North Bend | Washington | National Average |
|---|---|---|---|
| Overall | 161 | 120 | 100 |
| Services | 105 | 108 | 100 |
| Groceries | 108 | 108 | 100 |
| Health | 281 | 137 | 100 |
| Housing | 109 | 111 | 100 |
| Transportation | 111 | 111 | 100 |
| Utilities | 115 | 110 | 100 |
Source: Cost of living index, normalized to US average = 100
North Bend, WA Weather
The average high in North Bend is 59.4° and the average low is 42.1°.
There are 97.8 days of precipitation each year.
Expect an average of 62.6 inches of precipitation each year with 25.1 inches of snow.
| Stat | North Bend |
|---|---|
| Average Annual High | 59.4 |
| Average Annual Low | 42.1 |
| Annual Precipitation Days | 97.8 |
| Average Annual Precipitation | 62.6 |
| Average Annual Snowfall | 25.1 |
Average High
Days of Rain
Source: NOAA climate normals (30-year)
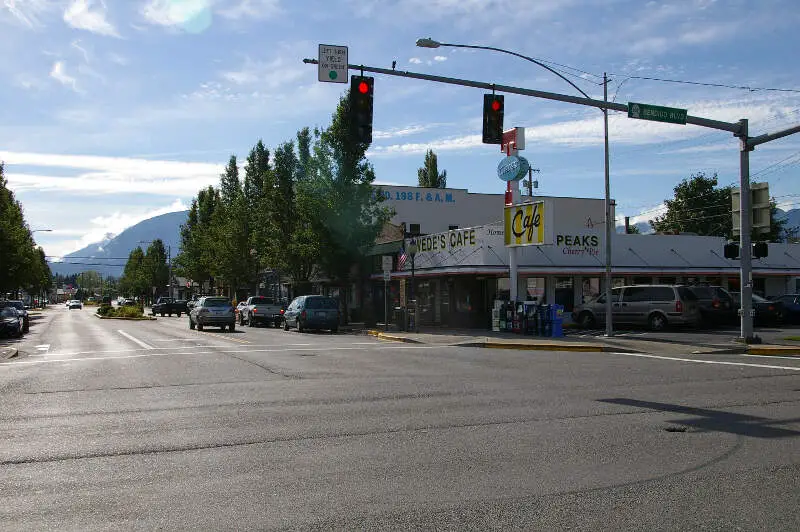
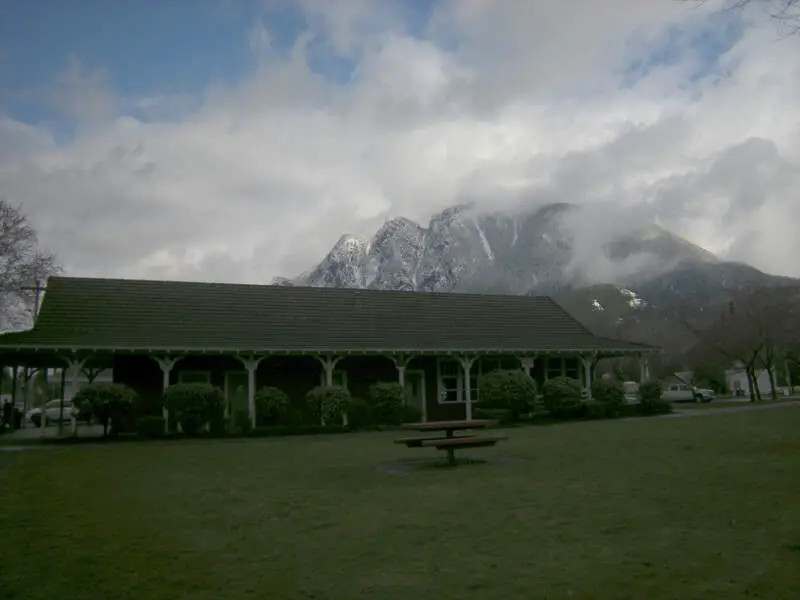
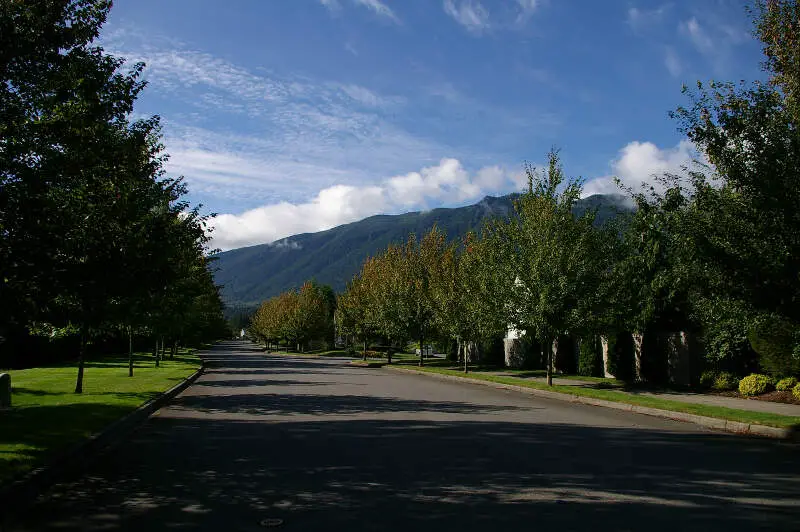
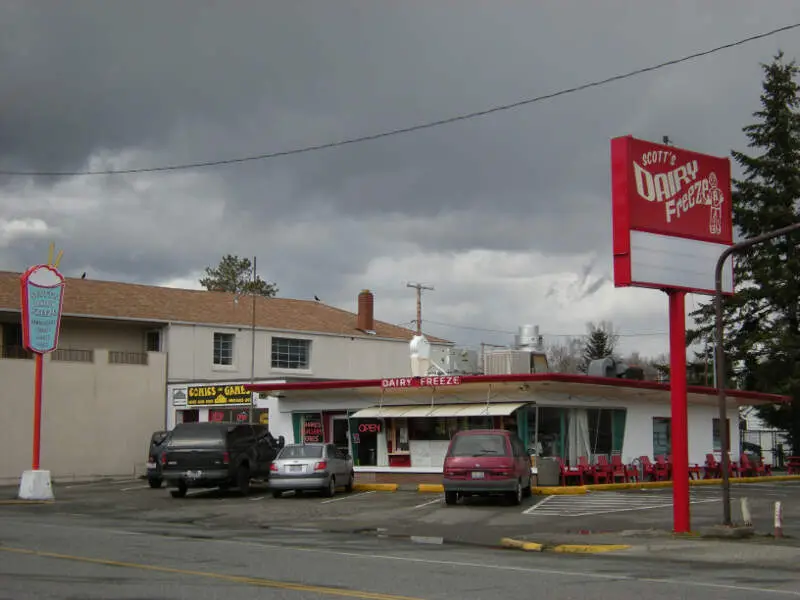
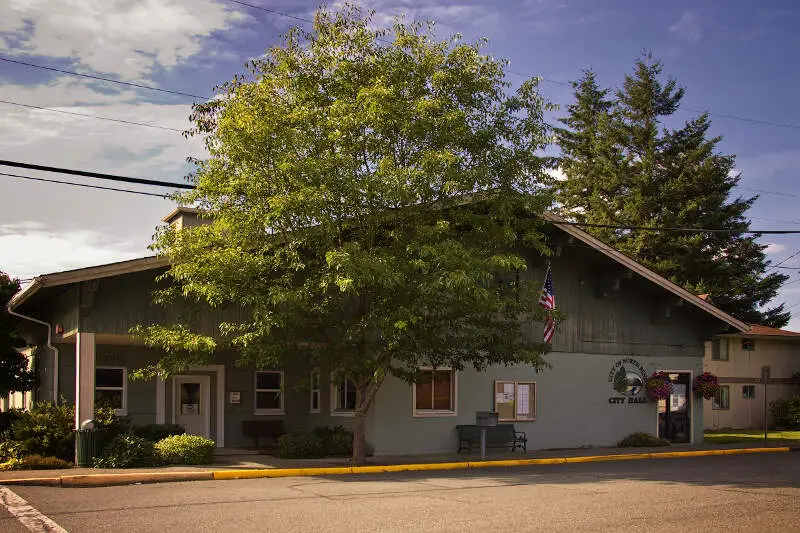
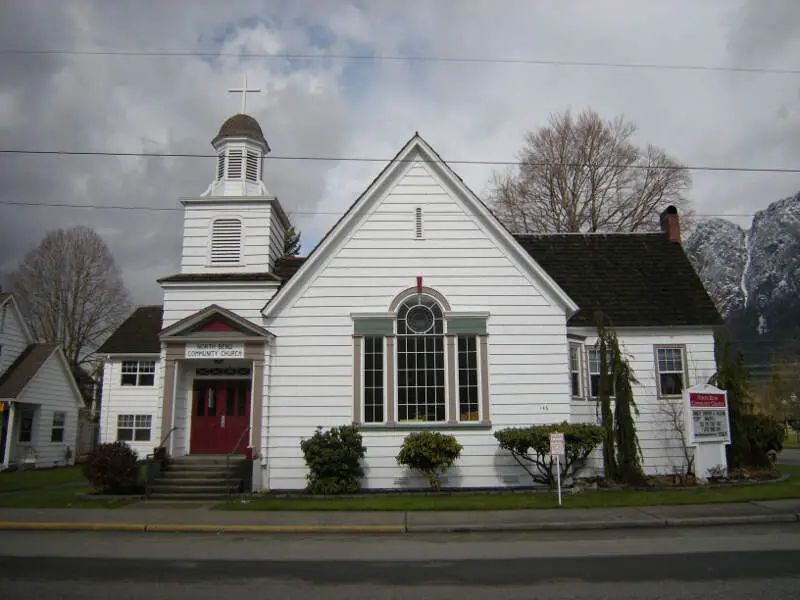
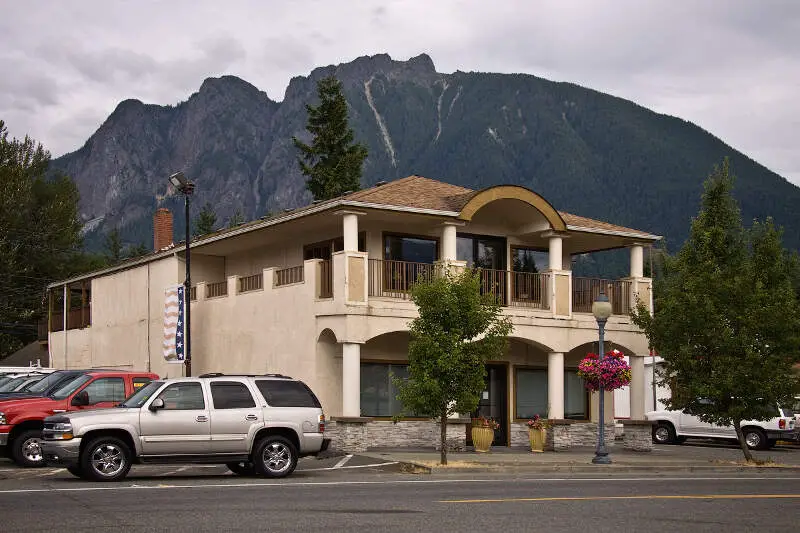
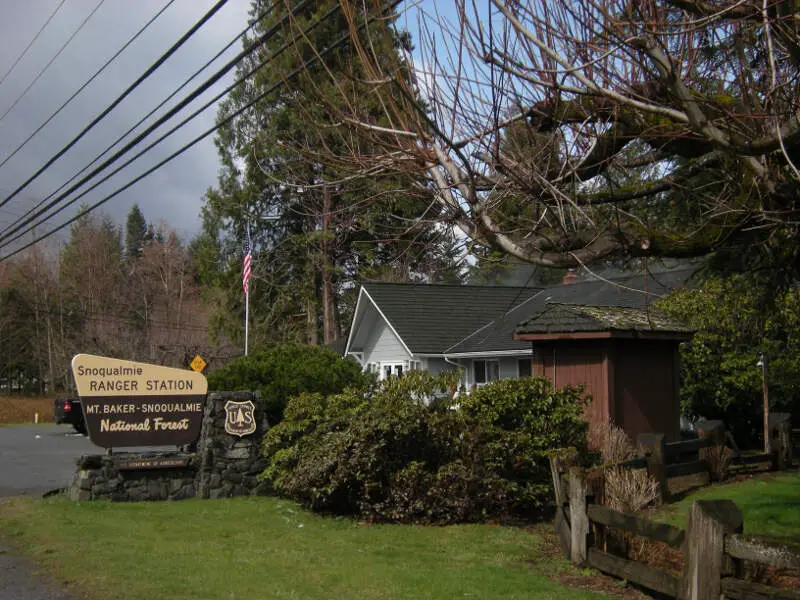
North Bend, WA Photos
Rankings & Articles For North Bend


Locations Around North Bend
Map Of North Bend, WA
Best Places Around North Bend
Issaquah, WA
Population 39,591
Snoqualmie, WA
Population 13,798
Renton, WA
Population 105,317
Hobart, WA
Population 6,552
Lake Morton-Berrydale, WA
Population 11,183
Union Hill-Novelty Hill, WA
Population 23,047
Covington, WA
Population 21,233
East Renton Highlands, WA
Population 12,582
Bellevue, WA
Population 151,847
Maple Valley, WA
Population 28,287
North Bend Demographics And Statistics
Population over time in North Bend
The current population in North Bend is 7,953. The population has increased 39.8% from 2010.
| Year | Population | % Change |
|---|---|---|
| 2024 | 7,953 | 2.7% |
| 2023 | 7,745 | 2.6% |
| 2022 | 7,549 | 2.1% |
| 2021 | 7,393 | 3.2% |
| 2020 | 7,161 | 2.5% |
| 2019 | 6,983 | 2.2% |
| 2018 | 6,830 | 2.8% |
| 2017 | 6,645 | 2.6% |
| 2016 | 6,475 | 2.7% |
| 2015 | 6,305 | 2.9% |
| 2014 | 6,127 | 3.0% |
| 2013 | 5,951 | 1.8% |
| 2012 | 5,847 | 1.6% |
| 2011 | 5,756 | 1.2% |
| 2010 | 5,688 | - |
Race / Ethnicity in North Bend
See the full breakdown
North Bend is:
68.8% White with 5,469 White residents.
0.0% African American with 0 African American residents.
1.8% American Indian with 141 American Indian residents.
6.3% Asian with 500 Asian residents.
0.0% Hawaiian with 0 Hawaiian residents.
0.2% Other with 18 Other residents.
9.6% Two Or More with 764 Two Or More residents.
13.3% Hispanic with 1,061 Hispanic residents.
| Race | North Bend | WA | USA |
|---|---|---|---|
| White | 68.8% | 63.1% | 57.4% |
| African American | 0.0% | 3.8% | 11.9% |
| American Indian | 1.8% | 0.8% | 0.5% |
| Asian | 6.3% | 9.7% | 5.9% |
| Hawaiian | 0.0% | 0.7% | 0.2% |
| Other | 0.2% | 0.6% | 0.6% |
| Two Or More | 9.6% | 6.8% | 4.3% |
| Hispanic | 13.3% | 14.4% | 19.3% |
Gender in North Bend
See the full breakdown
North Bend is 49.8% female with 3,957 female residents.
North Bend is 50.2% male with 3,995 male residents.
| Gender | North Bend | WA | USA |
|---|---|---|---|
| Female | 49.8% | 49.6% | 50.5% |
| Male | 50.2% | 50.4% | 49.5% |
Highest level of educational attainment in North Bend for adults over 25
See the full breakdown
2.0% of adults in North Bend completed < 9th grade.
1.0% of adults in North Bend completed 9-12th grade.
13.0% of adults in North Bend completed high school / ged.
15.0% of adults in North Bend completed some college.
6.0% of adults in North Bend completed associate's degree.
38.0% of adults in North Bend completed bachelor's degree.
21.0% of adults in North Bend completed master's degree.
3.0% of adults in North Bend completed professional degree.
1.0% of adults in North Bend completed doctorate degree.
| Education | North Bend | WA | USA |
|---|---|---|---|
| < 9th Grade | 2.0% | 4.0% | 4.0% |
| 9-12th Grade | 1.0% | 4.0% | 6.0% |
| High School / GED | 13.0% | 22.0% | 26.0% |
| Some College | 15.0% | 21.0% | 19.0% |
| Associate's Degree | 6.0% | 10.0% | 9.0% |
| Bachelor's Degree | 38.0% | 24.0% | 22.0% |
| Master's Degree | 21.0% | 11.0% | 10.0% |
| Professional Degree | 3.0% | 2.0% | 2.0% |
| Doctorate Degree | 1.0% | 2.0% | 2.0% |
Household Income For North Bend, Washington
See the full breakdown
2.1% of households in North Bend earn Less than $10,000.
0.3% of households in North Bend earn $10,000 to $14,999.
0.9% of households in North Bend earn $15,000 to $24,999.
0.6% of households in North Bend earn $25,000 to $34,999.
12.8% of households in North Bend earn $35,000 to $49,999.
8.6% of households in North Bend earn $50,000 to $74,999.
7.9% of households in North Bend earn $75,000 to $99,999.
10.6% of households in North Bend earn $100,000 to $149,999.
13.3% of households in North Bend earn $150,000 to $199,999.
42.7% of households in North Bend earn $200,000 or more.
| Income | North Bend | WA | USA |
|---|---|---|---|
| Less than $10,000 | 2.1% | 3.9% | 5.0% |
| $10,000 to $14,999 | 0.3% | 2.5% | 3.4% |
| $15,000 to $24,999 | 0.9% | 4.6% | 6.3% |
| $25,000 to $34,999 | 0.6% | 5.0% | 6.6% |
| $35,000 to $49,999 | 12.8% | 8.2% | 10.1% |
| $50,000 to $74,999 | 8.6% | 14.1% | 15.5% |
| $75,000 to $99,999 | 7.9% | 12.4% | 12.6% |
| $100,000 to $149,999 | 10.6% | 19.2% | 17.5% |
| $150,000 to $199,999 | 13.3% | 11.4% | 9.6% |
| $200,000 or more | 42.7% | 18.5% | 13.4% |
Source: U.S. Census ACS 5-year estimates (2024)


