Mount Vernon SnackAbility
Overall SnackAbility
Crime in Mount Vernon summary. We use data from the FBI to determine the crime rates in Mount Vernon. Key points include:
There were 693 total crimes in Mount Vernon in the last reporting year.
The overall crime rate per 100,000 people in Mount Vernon is 1,966.3 / 100k people.
The violent crime rate per 100,000 people in Mount Vernon is 190.1 / 100k people.
The property crime rate per 100,000 people in Mount Vernon is 1,776.2 / 100k people.
Overall, crime in Mount Vernon is -7.22% below the national average.
Total Crimes
Below National Average
Crime In Mount Vernon Comparison Table
| Statistic | Count Raw |
Mount Vernon / 100k People |
Washington / 100k People |
National / 100k People |
|---|---|---|---|---|
| Total Crimes Per 100K | 693 | 1,966.3 | 2,792.6 | 2,119.2 |
| Violent Crime | 67 | 190.1 | 326.1 | 359.0 |
| Murder | 1 | 2.8 | 3.8 | 5.0 |
| Robbery | 18 | 51.1 | 67.5 | 61.0 |
| Aggravated Assault | 44 | 124.8 | 217.0 | 256.0 |
| Property Crime | 626 | 1,776.2 | 2,466.5 | 1,760.0 |
| Burglary | 92 | 261.0 | 398.8 | 229.0 |
| Larceny | 476 | 1,350.6 | 1,634.2 | 1,272.0 |
| Car Theft | 58 | 164.6 | 433.5 | 259.0 |
Source: FBI Uniform Crime Reporting (2024)
Cost of living in Mount Vernon summary. We use data on the cost of living to determine how expensive it is to live in Mount Vernon. Real estate prices drive most of the variance in cost of living around Washington. Key points include:
The cost of living in Mount Vernon is 119 with 100 being average.
The cost of living in Mount Vernon is 1.2x higher than the national average.
The median home value in Mount Vernon is $586,879.
The median income in Mount Vernon is $75,777.
Mount Vernon's Overall Cost Of Living
Higher Than The National Average
Cost Of Living In Mount Vernon Comparison Table
| Living Expense | Mount Vernon | Washington | National Average |
|---|---|---|---|
| Overall | 119 | 120 | 100 |
| Services | 108 | 108 | 100 |
| Groceries | 110 | 108 | 100 |
| Health | 151 | 137 | 100 |
| Housing | 105 | 111 | 100 |
| Transportation | 109 | 111 | 100 |
| Utilities | 111 | 110 | 100 |
Source: Cost of living index, normalized to US average = 100
Mount Vernon, WA Weather
The average high in Mount Vernon is 58.5° and the average low is 42.1°.
There are 94.6 days of precipitation each year.
Expect an average of 39.9 inches of precipitation each year with 5.4 inches of snow.
| Stat | Mount Vernon |
|---|---|
| Average Annual High | 58.5 |
| Average Annual Low | 42.1 |
| Annual Precipitation Days | 94.6 |
| Average Annual Precipitation | 39.9 |
| Average Annual Snowfall | 5.4 |
Average High
Days of Rain
Source: NOAA climate normals (30-year)
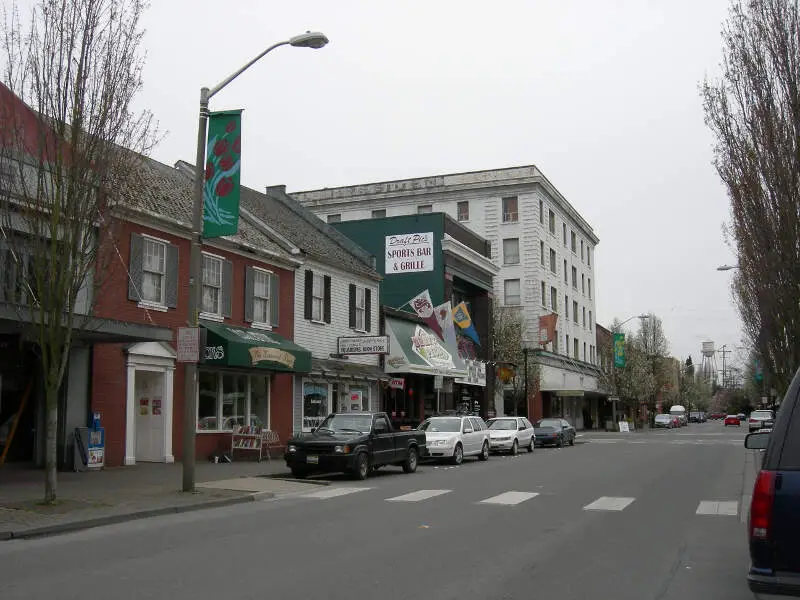
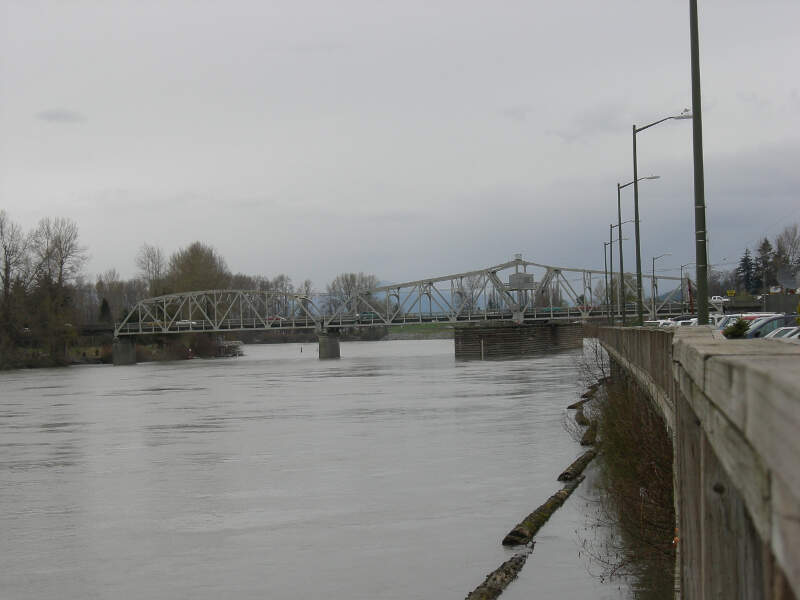
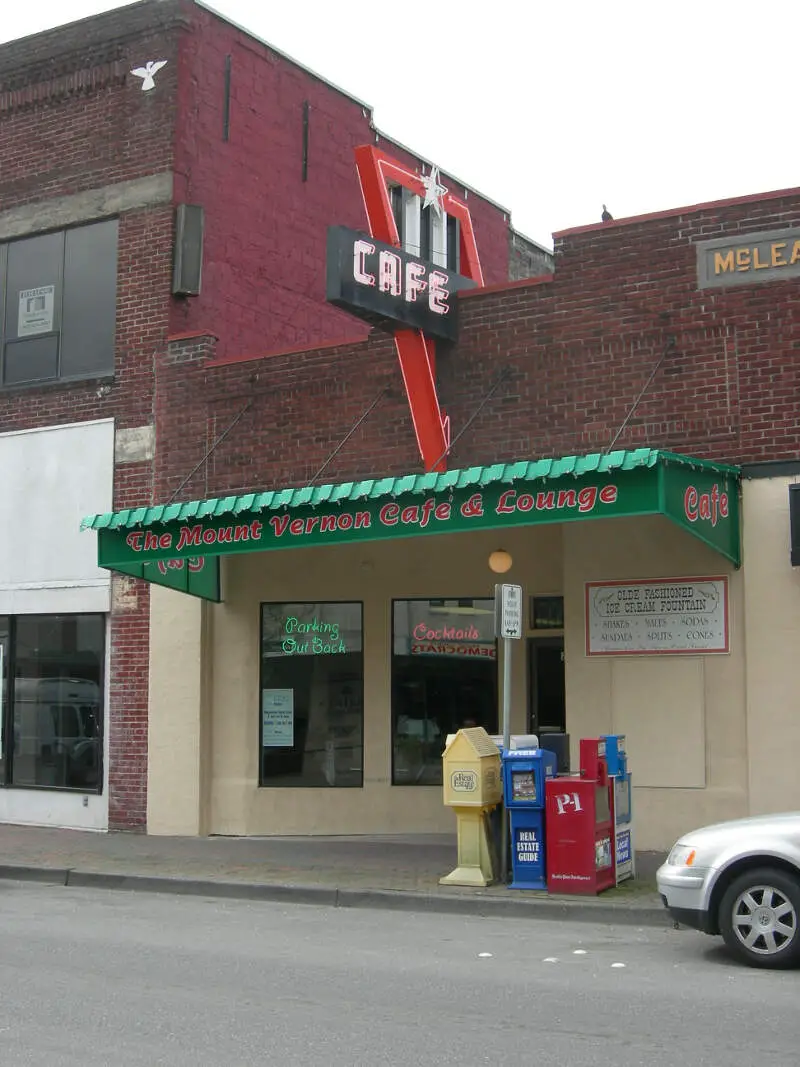
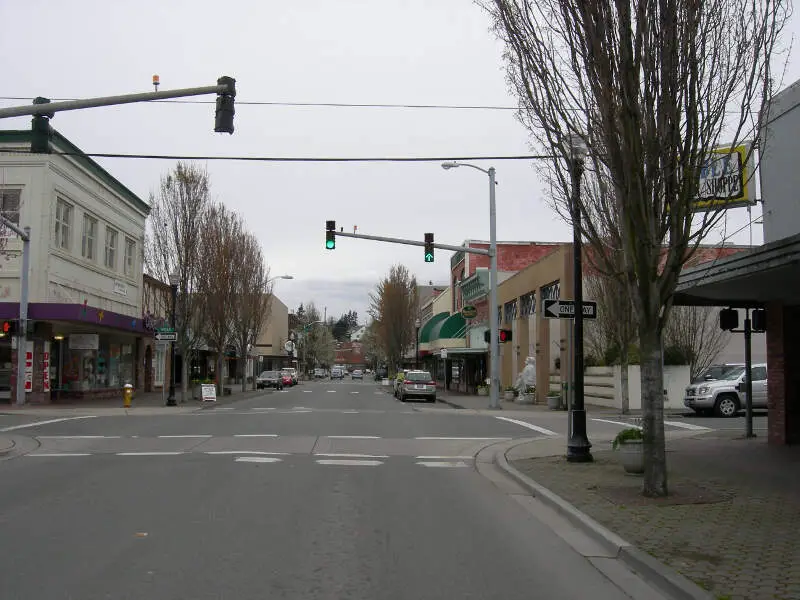
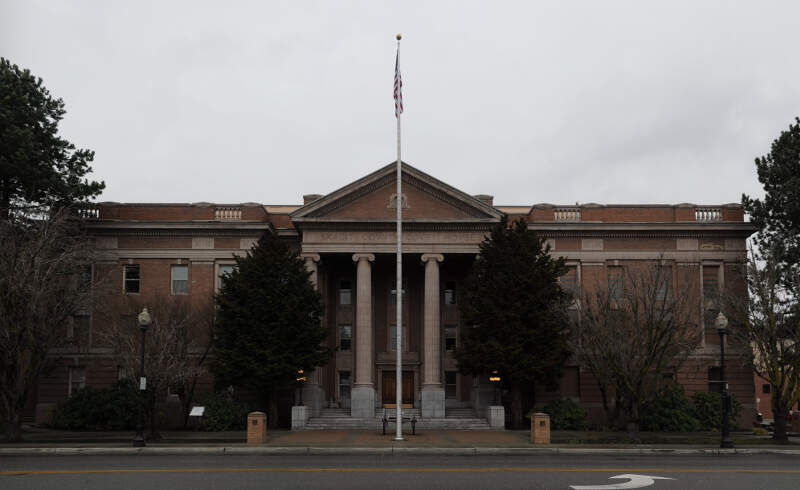
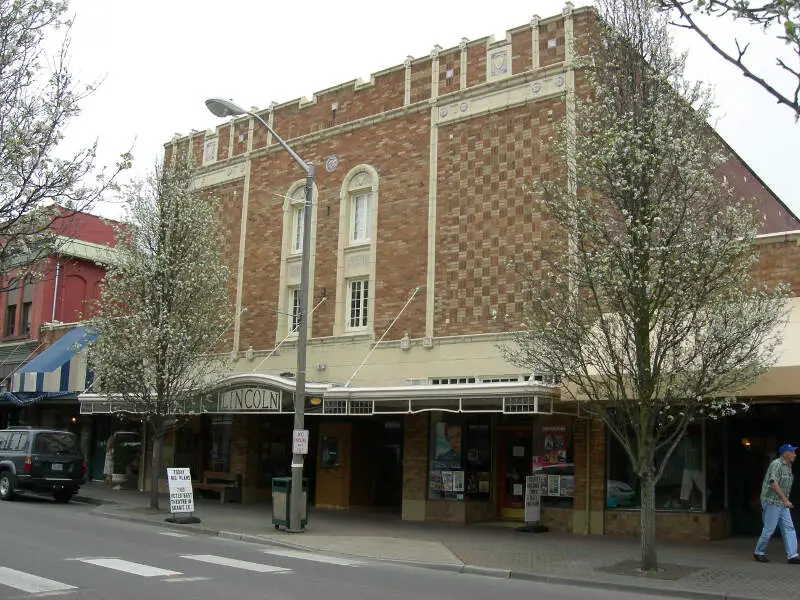
Mount Vernon, WA Photos


Rankings & Articles For Mount Vernon


Locations Around Mount Vernon
Map Of Mount Vernon, WA
Best Places Around Mount Vernon
Burlington, WA
Population 10,003
Anacortes, WA
Population 17,966
Arlington, WA
Population 21,095
Sedro-Woolley, WA
Population 12,831
Oak Harbor, WA
Population 24,362
Stanwood, WA
Population 8,373
Mount Vernon Demographics And Statistics
Population over time in Mount Vernon
The current population in Mount Vernon is 35,377. The population has increased 14.0% from 2010.
| Year | Population | % Change |
|---|---|---|
| 2024 | 35,377 | 0.2% |
| 2023 | 35,312 | 0.5% |
| 2022 | 35,120 | 0.8% |
| 2021 | 34,824 | -1.9% |
| 2020 | 35,502 | 1.4% |
| 2019 | 35,026 | 1.5% |
| 2018 | 34,504 | 2.1% |
| 2017 | 33,787 | 1.2% |
| 2016 | 33,388 | 1.3% |
| 2015 | 32,957 | 1.9% |
| 2014 | 32,356 | 0.9% |
| 2013 | 32,059 | 0.8% |
| 2012 | 31,804 | 1.1% |
| 2011 | 31,455 | 1.3% |
| 2010 | 31,044 | - |
Race / Ethnicity in Mount Vernon
See the full breakdown
Mount Vernon is:
53.6% White with 18,946 White residents.
1.4% African American with 479 African American residents.
0.3% American Indian with 122 American Indian residents.
3.3% Asian with 1,158 Asian residents.
0.3% Hawaiian with 108 Hawaiian residents.
0.5% Other with 162 Other residents.
3.9% Two Or More with 1,388 Two Or More residents.
36.8% Hispanic with 13,014 Hispanic residents.
| Race | Mount Vernon | WA | USA |
|---|---|---|---|
| White | 53.6% | 63.1% | 57.4% |
| African American | 1.4% | 3.8% | 11.9% |
| American Indian | 0.3% | 0.8% | 0.5% |
| Asian | 3.3% | 9.7% | 5.9% |
| Hawaiian | 0.3% | 0.7% | 0.2% |
| Other | 0.5% | 0.6% | 0.6% |
| Two Or More | 3.9% | 6.8% | 4.3% |
| Hispanic | 36.8% | 14.4% | 19.3% |
Gender in Mount Vernon
See the full breakdown
Mount Vernon is 51.4% female with 18,170 female residents.
Mount Vernon is 48.6% male with 17,207 male residents.
| Gender | Mount Vernon | WA | USA |
|---|---|---|---|
| Female | 51.4% | 49.6% | 50.5% |
| Male | 48.6% | 50.4% | 49.5% |
Highest level of educational attainment in Mount Vernon for adults over 25
See the full breakdown
5.0% of adults in Mount Vernon completed < 9th grade.
5.0% of adults in Mount Vernon completed 9-12th grade.
24.0% of adults in Mount Vernon completed high school / ged.
24.0% of adults in Mount Vernon completed some college.
13.0% of adults in Mount Vernon completed associate's degree.
17.0% of adults in Mount Vernon completed bachelor's degree.
9.0% of adults in Mount Vernon completed master's degree.
2.0% of adults in Mount Vernon completed professional degree.
1.0% of adults in Mount Vernon completed doctorate degree.
| Education | Mount Vernon | WA | USA |
|---|---|---|---|
| < 9th Grade | 5.0% | 4.0% | 4.0% |
| 9-12th Grade | 5.0% | 4.0% | 6.0% |
| High School / GED | 24.0% | 22.0% | 26.0% |
| Some College | 24.0% | 21.0% | 19.0% |
| Associate's Degree | 13.0% | 10.0% | 9.0% |
| Bachelor's Degree | 17.0% | 24.0% | 22.0% |
| Master's Degree | 9.0% | 11.0% | 10.0% |
| Professional Degree | 2.0% | 2.0% | 2.0% |
| Doctorate Degree | 1.0% | 2.0% | 2.0% |
Household Income For Mount Vernon, Washington
See the full breakdown
5.0% of households in Mount Vernon earn Less than $10,000.
3.6% of households in Mount Vernon earn $10,000 to $14,999.
6.3% of households in Mount Vernon earn $15,000 to $24,999.
8.3% of households in Mount Vernon earn $25,000 to $34,999.
10.2% of households in Mount Vernon earn $35,000 to $49,999.
16.1% of households in Mount Vernon earn $50,000 to $74,999.
12.7% of households in Mount Vernon earn $75,000 to $99,999.
20.5% of households in Mount Vernon earn $100,000 to $149,999.
10.0% of households in Mount Vernon earn $150,000 to $199,999.
7.3% of households in Mount Vernon earn $200,000 or more.
| Income | Mount Vernon | WA | USA |
|---|---|---|---|
| Less than $10,000 | 5.0% | 3.9% | 5.0% |
| $10,000 to $14,999 | 3.6% | 2.5% | 3.4% |
| $15,000 to $24,999 | 6.3% | 4.6% | 6.3% |
| $25,000 to $34,999 | 8.3% | 5.0% | 6.6% |
| $35,000 to $49,999 | 10.2% | 8.2% | 10.1% |
| $50,000 to $74,999 | 16.1% | 14.1% | 15.5% |
| $75,000 to $99,999 | 12.7% | 12.4% | 12.6% |
| $100,000 to $149,999 | 20.5% | 19.2% | 17.5% |
| $150,000 to $199,999 | 10.0% | 11.4% | 9.6% |
| $200,000 or more | 7.3% | 18.5% | 13.4% |
Source: U.S. Census ACS 5-year estimates (2024)


