Olympia SnackAbility
Overall SnackAbility
Crime in Olympia summary. We use data from the FBI to determine the crime rates in Olympia. Key points include:
There were 2,231 total crimes in Olympia in the last reporting year.
The overall crime rate per 100,000 people in Olympia is 4,000.0 / 100k people.
The violent crime rate per 100,000 people in Olympia is 564.8 / 100k people.
The property crime rate per 100,000 people in Olympia is 3,435.2 / 100k people.
Overall, crime in Olympia is 88.75% above the national average.
Total Crimes
Above National Average
Crime In Olympia Comparison Table
| Statistic | Count Raw |
Olympia / 100k People |
Washington / 100k People |
National / 100k People |
|---|---|---|---|---|
| Total Crimes Per 100K | 2,231 | 4,000.0 | 2,792.6 | 2,119.2 |
| Violent Crime | 315 | 564.8 | 326.1 | 359.0 |
| Murder | 4 | 7.2 | 3.8 | 5.0 |
| Robbery | 61 | 109.4 | 67.5 | 61.0 |
| Aggravated Assault | 215 | 385.5 | 217.0 | 256.0 |
| Property Crime | 1,916 | 3,435.2 | 2,466.5 | 1,760.0 |
| Burglary | 317 | 568.4 | 398.8 | 229.0 |
| Larceny | 1,392 | 2,495.7 | 1,634.2 | 1,272.0 |
| Car Theft | 207 | 371.1 | 433.5 | 259.0 |
Source: FBI Uniform Crime Reporting (2024)
Cost of living in Olympia summary. We use data on the cost of living to determine how expensive it is to live in Olympia. Real estate prices drive most of the variance in cost of living around Washington. Key points include:
The cost of living in Olympia is 125 with 100 being average.
The cost of living in Olympia is 1.2x higher than the national average.
The median home value in Olympia is $533,713.
The median income in Olympia is $81,302.
Olympia's Overall Cost Of Living
Higher Than The National Average
Cost Of Living In Olympia Comparison Table
| Living Expense | Olympia | Washington | National Average |
|---|---|---|---|
| Overall | 125 | 120 | 100 |
| Services | 106 | 108 | 100 |
| Groceries | 112 | 108 | 100 |
| Health | 167 | 137 | 100 |
| Housing | 112 | 111 | 100 |
| Transportation | 109 | 111 | 100 |
| Utilities | 113 | 110 | 100 |
Source: Cost of living index, normalized to US average = 100
Olympia, WA Weather
The average high in Olympia is 60.5° and the average low is 41.4°.
There are 104.9 days of precipitation each year.
Expect an average of 48.5 inches of precipitation each year with 7.9 inches of snow.
| Stat | Olympia |
|---|---|
| Average Annual High | 60.5 |
| Average Annual Low | 41.4 |
| Annual Precipitation Days | 104.9 |
| Average Annual Precipitation | 48.5 |
| Average Annual Snowfall | 7.9 |
Average High
Days of Rain
Source: NOAA climate normals (30-year)
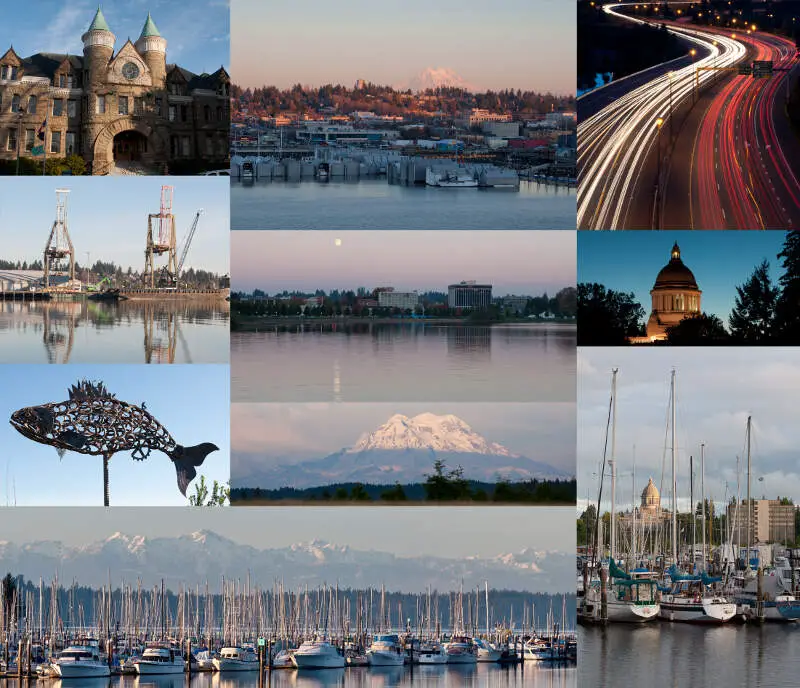
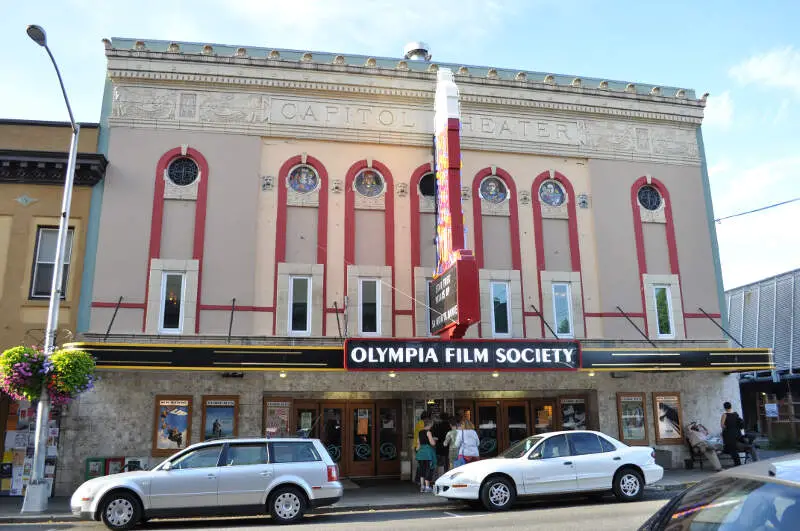
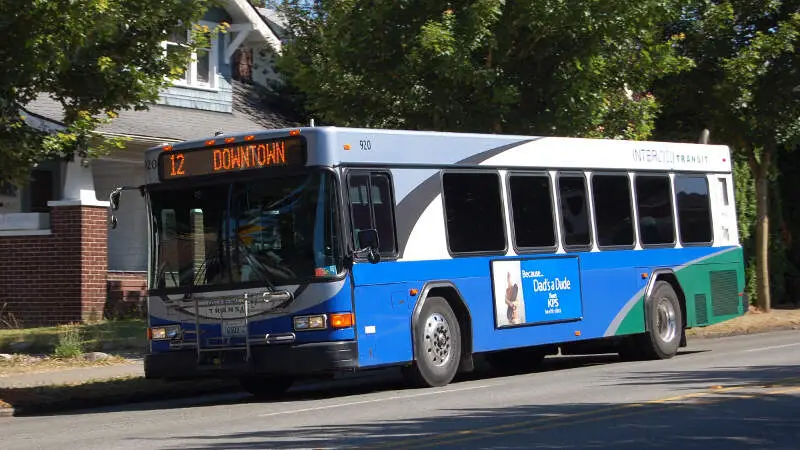
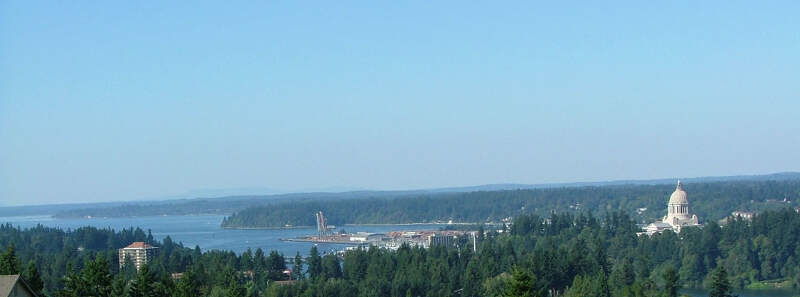
Olympia, WA Photos
Rankings & Articles For Olympia


Locations Around Olympia
Map Of Olympia, WA
Best Places Around Olympia
Shelton, WA
Population 10,612
Yelm, WA
Population 11,102
Lakewood, WA
Population 62,937
Fort Lewis, WA
Population 15,167
Tumwater, WA
Population 26,956
Lacey, WA
Population 57,737
Steilacoom, WA
Population 6,686
Tanglewilde, WA
Population 6,314
DuPont, WA
Population 9,931
Olympia Demographics And Statistics
Population over time in Olympia
The current population in Olympia is 55,951. The population has increased 22.4% from 2010.
| Year | Population | % Change |
|---|---|---|
| 2024 | 55,951 | 0.7% |
| 2023 | 55,583 | 0.8% |
| 2022 | 55,151 | 1.0% |
| 2021 | 54,579 | 4.4% |
| 2020 | 52,290 | 1.5% |
| 2019 | 51,534 | 1.4% |
| 2018 | 50,836 | 1.8% |
| 2017 | 49,928 | 0.6% |
| 2016 | 49,608 | 1.4% |
| 2015 | 48,941 | 2.3% |
| 2014 | 47,847 | 1.1% |
| 2013 | 47,335 | 1.2% |
| 2012 | 46,792 | 1.2% |
| 2011 | 46,240 | 1.2% |
| 2010 | 45,708 | - |
Race / Ethnicity in Olympia
See the full breakdown
Olympia is:
71.2% White with 39,834 White residents.
2.7% African American with 1,528 African American residents.
0.5% American Indian with 287 American Indian residents.
6.7% Asian with 3,748 Asian residents.
0.2% Hawaiian with 119 Hawaiian residents.
0.8% Other with 458 Other residents.
7.3% Two Or More with 4,067 Two Or More residents.
10.6% Hispanic with 5,910 Hispanic residents.
| Race | Olympia | WA | USA |
|---|---|---|---|
| White | 71.2% | 63.1% | 57.4% |
| African American | 2.7% | 3.8% | 11.9% |
| American Indian | 0.5% | 0.8% | 0.5% |
| Asian | 6.7% | 9.7% | 5.9% |
| Hawaiian | 0.2% | 0.7% | 0.2% |
| Other | 0.8% | 0.6% | 0.6% |
| Two Or More | 7.3% | 6.8% | 4.3% |
| Hispanic | 10.6% | 14.4% | 19.3% |
Gender in Olympia
See the full breakdown
Olympia is 51.5% female with 28,803 female residents.
Olympia is 48.5% male with 27,147 male residents.
| Gender | Olympia | WA | USA |
|---|---|---|---|
| Female | 51.5% | 49.6% | 50.5% |
| Male | 48.5% | 50.4% | 49.5% |
Highest level of educational attainment in Olympia for adults over 25
See the full breakdown
2.0% of adults in Olympia completed < 9th grade.
2.0% of adults in Olympia completed 9-12th grade.
17.0% of adults in Olympia completed high school / ged.
19.0% of adults in Olympia completed some college.
8.0% of adults in Olympia completed associate's degree.
31.0% of adults in Olympia completed bachelor's degree.
15.0% of adults in Olympia completed master's degree.
4.0% of adults in Olympia completed professional degree.
2.0% of adults in Olympia completed doctorate degree.
| Education | Olympia | WA | USA |
|---|---|---|---|
| < 9th Grade | 2.0% | 4.0% | 4.0% |
| 9-12th Grade | 2.0% | 4.0% | 6.0% |
| High School / GED | 17.0% | 22.0% | 26.0% |
| Some College | 19.0% | 21.0% | 19.0% |
| Associate's Degree | 8.0% | 10.0% | 9.0% |
| Bachelor's Degree | 31.0% | 24.0% | 22.0% |
| Master's Degree | 15.0% | 11.0% | 10.0% |
| Professional Degree | 4.0% | 2.0% | 2.0% |
| Doctorate Degree | 2.0% | 2.0% | 2.0% |
Household Income For Olympia, Washington
See the full breakdown
7.9% of households in Olympia earn Less than $10,000.
2.8% of households in Olympia earn $10,000 to $14,999.
5.2% of households in Olympia earn $15,000 to $24,999.
5.4% of households in Olympia earn $25,000 to $34,999.
9.5% of households in Olympia earn $35,000 to $49,999.
16.3% of households in Olympia earn $50,000 to $74,999.
12.9% of households in Olympia earn $75,000 to $99,999.
20.7% of households in Olympia earn $100,000 to $149,999.
9.6% of households in Olympia earn $150,000 to $199,999.
9.8% of households in Olympia earn $200,000 or more.
| Income | Olympia | WA | USA |
|---|---|---|---|
| Less than $10,000 | 7.9% | 3.9% | 5.0% |
| $10,000 to $14,999 | 2.8% | 2.5% | 3.4% |
| $15,000 to $24,999 | 5.2% | 4.6% | 6.3% |
| $25,000 to $34,999 | 5.4% | 5.0% | 6.6% |
| $35,000 to $49,999 | 9.5% | 8.2% | 10.1% |
| $50,000 to $74,999 | 16.3% | 14.1% | 15.5% |
| $75,000 to $99,999 | 12.9% | 12.4% | 12.6% |
| $100,000 to $149,999 | 20.7% | 19.2% | 17.5% |
| $150,000 to $199,999 | 9.6% | 11.4% | 9.6% |
| $200,000 or more | 9.8% | 18.5% | 13.4% |
Source: U.S. Census ACS 5-year estimates (2024)


