Spokane SnackAbility
Overall SnackAbility
Crime in Spokane summary. We use data from the FBI to determine the crime rates in Spokane. Key points include:
There were 12,660 total crimes in Spokane in the last reporting year.
The overall crime rate per 100,000 people in Spokane is 5,515.6 / 100k people.
The violent crime rate per 100,000 people in Spokane is 674.9 / 100k people.
The property crime rate per 100,000 people in Spokane is 4,840.8 / 100k people.
Overall, crime in Spokane is 160.27% above the national average.
Total Crimes
Above National Average
Crime In Spokane Comparison Table
| Statistic | Count Raw |
Spokane / 100k People |
Washington / 100k People |
National / 100k People |
|---|---|---|---|---|
| Total Crimes Per 100K | 12,660 | 5,515.6 | 2,792.6 | 2,119.2 |
| Violent Crime | 1,549 | 674.9 | 326.1 | 359.0 |
| Murder | 16 | 7.0 | 3.8 | 5.0 |
| Robbery | 333 | 145.1 | 67.5 | 61.0 |
| Aggravated Assault | 1,024 | 446.1 | 217.0 | 256.0 |
| Property Crime | 11,111 | 4,840.8 | 2,466.5 | 1,760.0 |
| Burglary | 1,484 | 646.5 | 398.8 | 229.0 |
| Larceny | 8,421 | 3,668.8 | 1,634.2 | 1,272.0 |
| Car Theft | 1,206 | 525.4 | 433.5 | 259.0 |
Source: FBI Uniform Crime Reporting (2024)
Cost of living in Spokane summary. We use data on the cost of living to determine how expensive it is to live in Spokane. Real estate prices drive most of the variance in cost of living around Washington. Key points include:
The cost of living in Spokane is 109 with 100 being average.
The cost of living in Spokane is 1.1x higher than the national average.
The median home value in Spokane is $395,324.
The median income in Spokane is $70,064.
Spokane's Overall Cost Of Living
Higher Than The National Average
Cost Of Living In Spokane Comparison Table
| Living Expense | Spokane | Washington | National Average |
|---|---|---|---|
| Overall | 109 | 120 | 100 |
| Services | 105 | 108 | 100 |
| Groceries | 114 | 108 | 100 |
| Health | 106 | 137 | 100 |
| Housing | 116 | 111 | 100 |
| Transportation | 111 | 111 | 100 |
| Utilities | 113 | 110 | 100 |
Source: Cost of living index, normalized to US average = 100
Spokane, WA Weather
The average high in Spokane is 58.7° and the average low is 37.3°.
There are 50.9 days of precipitation each year.
Expect an average of 16.2 inches of precipitation each year with 44.9 inches of snow.
| Stat | Spokane |
|---|---|
| Average Annual High | 58.7 |
| Average Annual Low | 37.3 |
| Annual Precipitation Days | 50.9 |
| Average Annual Precipitation | 16.2 |
| Average Annual Snowfall | 44.9 |
Average High
Days of Rain
Source: NOAA climate normals (30-year)
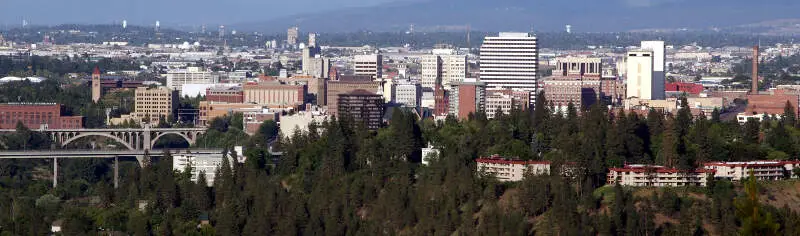
Spokane, WA Photos


2 Reviews & Comments About Spokane

See, this is why I love Washington, all the diversity! Where you can drive to the hood and in 2 miles be in redneck heaven. Brilliant. Trust me I know, I live in Spokane. ugh.
Property crime is terrible, violent crime is also on the rise, and the local DA office and judges who run the justice system play "catch & release" without ever punishing any criminals..
I'm honestly surprised that Spokane didn't hit #1 and Fife did.
Rankings & Articles For Spokane


Locations Around Spokane
Map Of Spokane, WA
Best Places Around Spokane
Airway Heights, WA
Population 11,245
Cheney, WA
Population 12,804
Spokane Valley, WA
Population 106,365
Liberty Lake, WA
Population 12,737
Country Homes, WA
Population 6,198
Mead, WA
Population 6,893
Otis Orchards-East Farms, WA
Population 5,454
Town and Country, WA
Population 4,890
Spokane Demographics And Statistics
Population over time in Spokane
The current population in Spokane is 230,293. The population has increased 11.5% from 2010.
| Year | Population | % Change |
|---|---|---|
| 2024 | 230,293 | 0.5% |
| 2023 | 229,228 | 0.6% |
| 2022 | 227,922 | 1.0% |
| 2021 | 225,709 | 3.0% |
| 2020 | 219,185 | 0.8% |
| 2019 | 217,353 | 1.2% |
| 2018 | 214,804 | 0.9% |
| 2017 | 212,982 | 0.4% |
| 2016 | 212,078 | 0.7% |
| 2015 | 210,695 | 0.3% |
| 2014 | 210,142 | 0.3% |
| 2013 | 209,478 | 0.4% |
| 2012 | 208,701 | 0.3% |
| 2011 | 208,040 | 0.7% |
| 2010 | 206,541 | - |
Race / Ethnicity in Spokane
See the full breakdown
Spokane is:
77.6% White with 178,707 White residents.
2.8% African American with 6,361 African American residents.
0.8% American Indian with 1,899 American Indian residents.
2.5% Asian with 5,839 Asian residents.
0.8% Hawaiian with 1,804 Hawaiian residents.
0.5% Other with 1,072 Other residents.
6.7% Two Or More with 15,329 Two Or More residents.
8.4% Hispanic with 19,282 Hispanic residents.
| Race | Spokane | WA | USA |
|---|---|---|---|
| White | 77.6% | 63.1% | 57.4% |
| African American | 2.8% | 3.8% | 11.9% |
| American Indian | 0.8% | 0.8% | 0.5% |
| Asian | 2.5% | 9.7% | 5.9% |
| Hawaiian | 0.8% | 0.7% | 0.2% |
| Other | 0.5% | 0.6% | 0.6% |
| Two Or More | 6.7% | 6.8% | 4.3% |
| Hispanic | 8.4% | 14.4% | 19.3% |
Gender in Spokane
See the full breakdown
Spokane is 49.9% female with 114,979 female residents.
Spokane is 50.1% male with 115,313 male residents.
| Gender | Spokane | WA | USA |
|---|---|---|---|
| Female | 49.9% | 49.6% | 50.5% |
| Male | 50.1% | 50.4% | 49.5% |
Highest level of educational attainment in Spokane for adults over 25
See the full breakdown
2.0% of adults in Spokane completed < 9th grade.
4.0% of adults in Spokane completed 9-12th grade.
24.0% of adults in Spokane completed high school / ged.
24.0% of adults in Spokane completed some college.
12.0% of adults in Spokane completed associate's degree.
21.0% of adults in Spokane completed bachelor's degree.
9.0% of adults in Spokane completed master's degree.
2.0% of adults in Spokane completed professional degree.
2.0% of adults in Spokane completed doctorate degree.
| Education | Spokane | WA | USA |
|---|---|---|---|
| < 9th Grade | 2.0% | 4.0% | 4.0% |
| 9-12th Grade | 4.0% | 4.0% | 6.0% |
| High School / GED | 24.0% | 22.0% | 26.0% |
| Some College | 24.0% | 21.0% | 19.0% |
| Associate's Degree | 12.0% | 10.0% | 9.0% |
| Bachelor's Degree | 21.0% | 24.0% | 22.0% |
| Master's Degree | 9.0% | 11.0% | 10.0% |
| Professional Degree | 2.0% | 2.0% | 2.0% |
| Doctorate Degree | 2.0% | 2.0% | 2.0% |
Household Income For Spokane, Washington
See the full breakdown
4.9% of households in Spokane earn Less than $10,000.
5.0% of households in Spokane earn $10,000 to $14,999.
6.6% of households in Spokane earn $15,000 to $24,999.
7.4% of households in Spokane earn $25,000 to $34,999.
11.3% of households in Spokane earn $35,000 to $49,999.
18.2% of households in Spokane earn $50,000 to $74,999.
12.9% of households in Spokane earn $75,000 to $99,999.
17.8% of households in Spokane earn $100,000 to $149,999.
7.8% of households in Spokane earn $150,000 to $199,999.
8.1% of households in Spokane earn $200,000 or more.
| Income | Spokane | WA | USA |
|---|---|---|---|
| Less than $10,000 | 4.9% | 3.9% | 5.0% |
| $10,000 to $14,999 | 5.0% | 2.5% | 3.4% |
| $15,000 to $24,999 | 6.6% | 4.6% | 6.3% |
| $25,000 to $34,999 | 7.4% | 5.0% | 6.6% |
| $35,000 to $49,999 | 11.3% | 8.2% | 10.1% |
| $50,000 to $74,999 | 18.2% | 14.1% | 15.5% |
| $75,000 to $99,999 | 12.9% | 12.4% | 12.6% |
| $100,000 to $149,999 | 17.8% | 19.2% | 17.5% |
| $150,000 to $199,999 | 7.8% | 11.4% | 9.6% |
| $200,000 or more | 8.1% | 18.5% | 13.4% |
Source: U.S. Census ACS 5-year estimates (2024)


