Cheney SnackAbility
Overall SnackAbility
Crime in Cheney summary. We use data from the FBI to determine the crime rates in Cheney. Key points include:
There were 253 total crimes in Cheney in the last reporting year.
The overall crime rate per 100,000 people in Cheney is 2,041.5 / 100k people.
The violent crime rate per 100,000 people in Cheney is 371.2 / 100k people.
The property crime rate per 100,000 people in Cheney is 1,670.3 / 100k people.
Overall, crime in Cheney is -3.67% below the national average.
Total Crimes
Below National Average
Crime In Cheney Comparison Table
| Statistic | Count Raw |
Cheney / 100k People |
Washington / 100k People |
National / 100k People |
|---|---|---|---|---|
| Total Crimes Per 100K | 253 | 2,041.5 | 2,792.6 | 2,119.2 |
| Violent Crime | 46 | 371.2 | 326.1 | 359.0 |
| Murder | 0 | 0.0 | 3.8 | 5.0 |
| Robbery | 5 | 40.3 | 67.5 | 61.0 |
| Aggravated Assault | 26 | 209.8 | 217.0 | 256.0 |
| Property Crime | 207 | 1,670.3 | 2,466.5 | 1,760.0 |
| Burglary | 26 | 209.8 | 398.8 | 229.0 |
| Larceny | 163 | 1,315.3 | 1,634.2 | 1,272.0 |
| Car Theft | 18 | 145.2 | 433.5 | 259.0 |
Source: FBI Uniform Crime Reporting (2024)
Cost of living in Cheney summary. We use data on the cost of living to determine how expensive it is to live in Cheney. Real estate prices drive most of the variance in cost of living around Washington. Key points include:
The cost of living in Cheney is 111 with 100 being average.
The cost of living in Cheney is 1.1x higher than the national average.
The median home value in Cheney is $420,133.
The median income in Cheney is $54,503.
Cheney's Overall Cost Of Living
Higher Than The National Average
Cost Of Living In Cheney Comparison Table
| Living Expense | Cheney | Washington | National Average |
|---|---|---|---|
| Overall | 111 | 120 | 100 |
| Services | 106 | 108 | 100 |
| Groceries | 113 | 108 | 100 |
| Health | 118 | 137 | 100 |
| Housing | 114 | 111 | 100 |
| Transportation | 110 | 111 | 100 |
| Utilities | 112 | 110 | 100 |
Source: Cost of living index, normalized to US average = 100
Cheney, WA Weather
The average high in Cheney is 57.1° and the average low is 36.1°.
There are 53.0 days of precipitation each year.
Expect an average of 17.4 inches of precipitation each year with 44.5 inches of snow.
| Stat | Cheney |
|---|---|
| Average Annual High | 57.1 |
| Average Annual Low | 36.1 |
| Annual Precipitation Days | 53.0 |
| Average Annual Precipitation | 17.4 |
| Average Annual Snowfall | 44.5 |
Average High
Days of Rain
Source: NOAA climate normals (30-year)
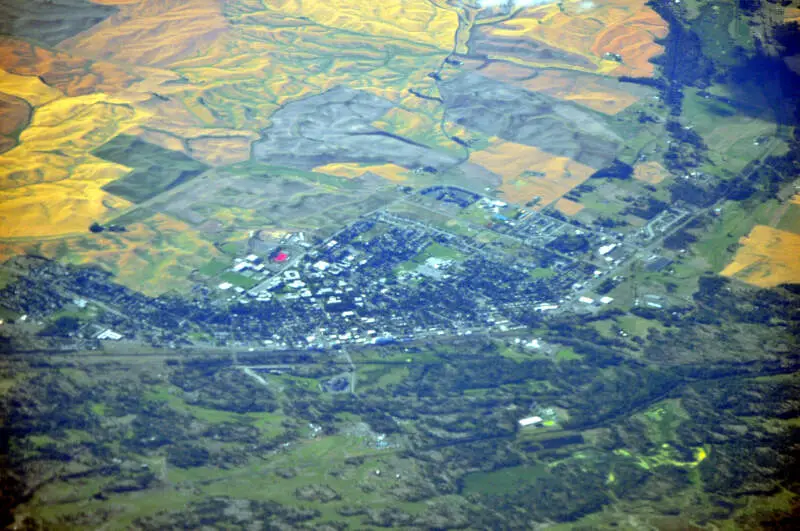
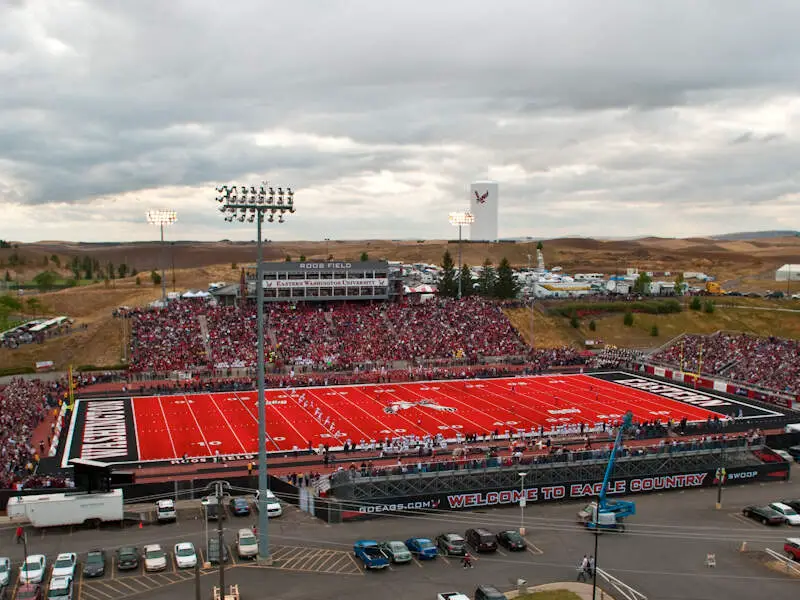
Cheney, WA Photos
Rankings & Articles For Cheney


Locations Around Cheney
Map Of Cheney, WA
Best Places Around Cheney
Airway Heights, WA
Population 11,245
Spokane, WA
Population 230,293
Spokane Valley, WA
Population 106,365
Liberty Lake, WA
Population 12,737
Country Homes, WA
Population 6,198
Mead, WA
Population 6,893
Otis Orchards-East Farms, WA
Population 5,454
Hayden, ID
Population 16,338
Post Falls, ID
Population 43,391
Town and Country, WA
Population 4,890
Cheney Demographics And Statistics
Population over time in Cheney
The current population in Cheney is 12,804. The population has increased 24.5% from 2010.
| Year | Population | % Change |
|---|---|---|
| 2024 | 12,804 | -0.2% |
| 2023 | 12,830 | -0.1% |
| 2022 | 12,848 | 0.8% |
| 2021 | 12,743 | 2.3% |
| 2020 | 12,455 | 2.4% |
| 2019 | 12,165 | 1.7% |
| 2018 | 11,962 | 1.9% |
| 2017 | 11,735 | 2.2% |
| 2016 | 11,479 | 2.8% |
| 2015 | 11,171 | 1.4% |
| 2014 | 11,014 | 1.7% |
| 2013 | 10,828 | 1.9% |
| 2012 | 10,631 | 2.0% |
| 2011 | 10,422 | 1.4% |
| 2010 | 10,283 | - |
Race / Ethnicity in Cheney
See the full breakdown
Cheney is:
74.4% White with 9,523 White residents.
1.1% African American with 135 African American residents.
1.4% American Indian with 180 American Indian residents.
3.5% Asian with 447 Asian residents.
0.3% Hawaiian with 40 Hawaiian residents.
0.5% Other with 69 Other residents.
8.1% Two Or More with 1,041 Two Or More residents.
10.7% Hispanic with 1,369 Hispanic residents.
| Race | Cheney | WA | USA |
|---|---|---|---|
| White | 74.4% | 63.1% | 57.4% |
| African American | 1.1% | 3.8% | 11.9% |
| American Indian | 1.4% | 0.8% | 0.5% |
| Asian | 3.5% | 9.7% | 5.9% |
| Hawaiian | 0.3% | 0.7% | 0.2% |
| Other | 0.5% | 0.6% | 0.6% |
| Two Or More | 8.1% | 6.8% | 4.3% |
| Hispanic | 10.7% | 14.4% | 19.3% |
Gender in Cheney
See the full breakdown
Cheney is 53.4% female with 6,834 female residents.
Cheney is 46.6% male with 5,969 male residents.
| Gender | Cheney | WA | USA |
|---|---|---|---|
| Female | 53.4% | 49.6% | 50.5% |
| Male | 46.6% | 50.4% | 49.5% |
Highest level of educational attainment in Cheney for adults over 25
See the full breakdown
3.0% of adults in Cheney completed < 9th grade.
2.0% of adults in Cheney completed 9-12th grade.
18.0% of adults in Cheney completed high school / ged.
27.0% of adults in Cheney completed some college.
12.0% of adults in Cheney completed associate's degree.
23.0% of adults in Cheney completed bachelor's degree.
11.0% of adults in Cheney completed master's degree.
1.0% of adults in Cheney completed professional degree.
3.0% of adults in Cheney completed doctorate degree.
| Education | Cheney | WA | USA |
|---|---|---|---|
| < 9th Grade | 3.0% | 4.0% | 4.0% |
| 9-12th Grade | 2.0% | 4.0% | 6.0% |
| High School / GED | 18.0% | 22.0% | 26.0% |
| Some College | 27.0% | 21.0% | 19.0% |
| Associate's Degree | 12.0% | 10.0% | 9.0% |
| Bachelor's Degree | 23.0% | 24.0% | 22.0% |
| Master's Degree | 11.0% | 11.0% | 10.0% |
| Professional Degree | 1.0% | 2.0% | 2.0% |
| Doctorate Degree | 3.0% | 2.0% | 2.0% |
Household Income For Cheney, Washington
See the full breakdown
15.2% of households in Cheney earn Less than $10,000.
5.2% of households in Cheney earn $10,000 to $14,999.
8.2% of households in Cheney earn $15,000 to $24,999.
8.5% of households in Cheney earn $25,000 to $34,999.
8.1% of households in Cheney earn $35,000 to $49,999.
15.4% of households in Cheney earn $50,000 to $74,999.
11.9% of households in Cheney earn $75,000 to $99,999.
16.5% of households in Cheney earn $100,000 to $149,999.
4.1% of households in Cheney earn $150,000 to $199,999.
7.0% of households in Cheney earn $200,000 or more.
| Income | Cheney | WA | USA |
|---|---|---|---|
| Less than $10,000 | 15.2% | 3.9% | 5.0% |
| $10,000 to $14,999 | 5.2% | 2.5% | 3.4% |
| $15,000 to $24,999 | 8.2% | 4.6% | 6.3% |
| $25,000 to $34,999 | 8.5% | 5.0% | 6.6% |
| $35,000 to $49,999 | 8.1% | 8.2% | 10.1% |
| $50,000 to $74,999 | 15.4% | 14.1% | 15.5% |
| $75,000 to $99,999 | 11.9% | 12.4% | 12.6% |
| $100,000 to $149,999 | 16.5% | 19.2% | 17.5% |
| $150,000 to $199,999 | 4.1% | 11.4% | 9.6% |
| $200,000 or more | 7.0% | 18.5% | 13.4% |
Source: U.S. Census ACS 5-year estimates (2024)


