Beloit SnackAbility
Overall SnackAbility
Crime in Beloit summary. We use data from the FBI to determine the crime rates in Beloit. Key points include:
There were 944 total crimes in Beloit in the last reporting year.
The overall crime rate per 100,000 people in Beloit is 2,605.5 / 100k people.
The violent crime rate per 100,000 people in Beloit is 391.9 / 100k people.
The property crime rate per 100,000 people in Beloit is 2,213.6 / 100k people.
Overall, crime in Beloit is 22.95% above the national average.
Total Crimes
Above National Average
Crime In Beloit Comparison Table
| Statistic | Count Raw |
Beloit / 100k People |
Wisconsin / 100k People |
National / 100k People |
|---|---|---|---|---|
| Total Crimes Per 100K | 944 | 2,605.5 | 1,432.6 | 2,119.2 |
| Violent Crime | 142 | 391.9 | 278.5 | 359.0 |
| Murder | 4 | 11.0 | 4.2 | 5.0 |
| Robbery | 22 | 60.7 | 39.4 | 61.0 |
| Aggravated Assault | 87 | 240.1 | 200.1 | 256.0 |
| Property Crime | 802 | 2,213.6 | 1,154.1 | 1,760.0 |
| Burglary | 79 | 218.0 | 117.2 | 229.0 |
| Larceny | 659 | 1,818.9 | 875.6 | 1,272.0 |
| Car Theft | 64 | 176.6 | 161.3 | 259.0 |
Source: FBI Uniform Crime Reporting (2024)
Cost of living in Beloit summary. We use data on the cost of living to determine how expensive it is to live in Beloit. Real estate prices drive most of the variance in cost of living around Wisconsin. Key points include:
The cost of living in Beloit is 88 with 100 being average.
The cost of living in Beloit is 0.9x lower than the national average.
The median home value in Beloit is $198,920.
The median income in Beloit is $62,663.
Beloit's Overall Cost Of Living
Lower Than The National Average
Cost Of Living In Beloit Comparison Table
| Living Expense | Beloit | Wisconsin | National Average |
|---|---|---|---|
| Overall | 88 | 98 | 100 |
| Services | 97 | 98 | 100 |
| Groceries | 97 | 100 | 100 |
| Health | 64 | 91 | 100 |
| Housing | 99 | 99 | 100 |
| Transportation | 100 | 102 | 100 |
| Utilities | 98 | 100 | 100 |
Source: Cost of living index, normalized to US average = 100
Beloit, WI Weather
The average high in Beloit is 57.6° and the average low is 37.9°.
There are 66.9 days of precipitation each year.
Expect an average of 35.6 inches of precipitation each year with 32.5 inches of snow.
| Stat | Beloit |
|---|---|
| Average Annual High | 57.6 |
| Average Annual Low | 37.9 |
| Annual Precipitation Days | 66.9 |
| Average Annual Precipitation | 35.6 |
| Average Annual Snowfall | 32.5 |
Average High
Days of Rain
Source: NOAA climate normals (30-year)
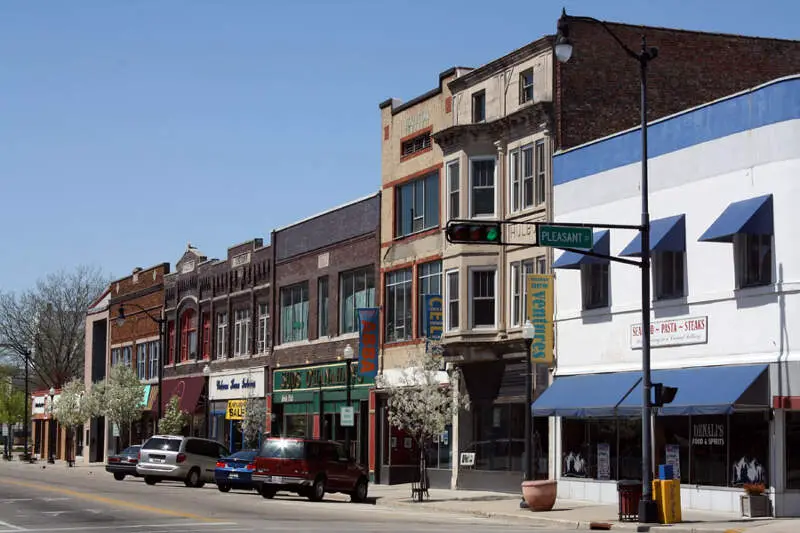
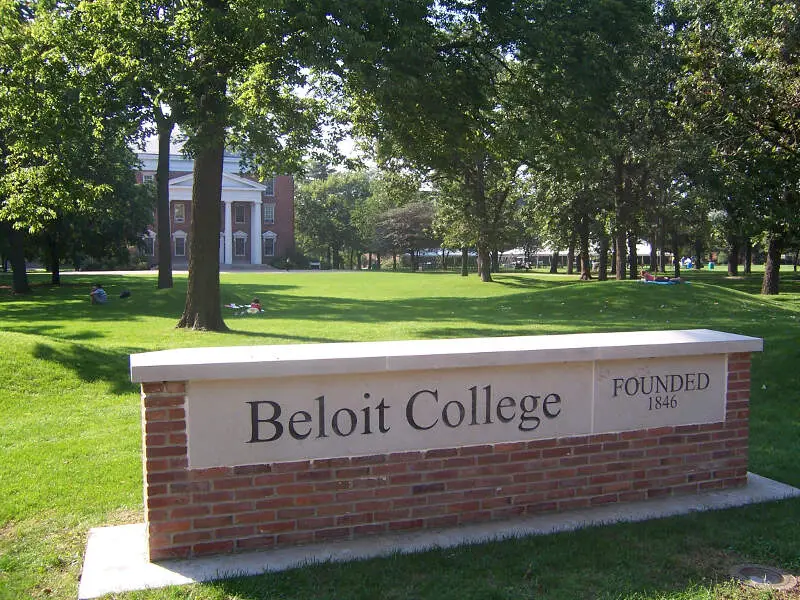
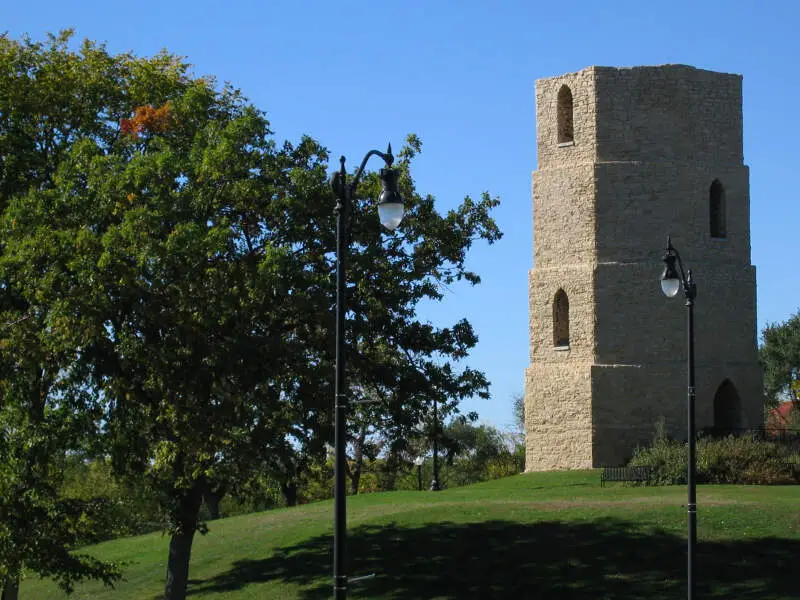
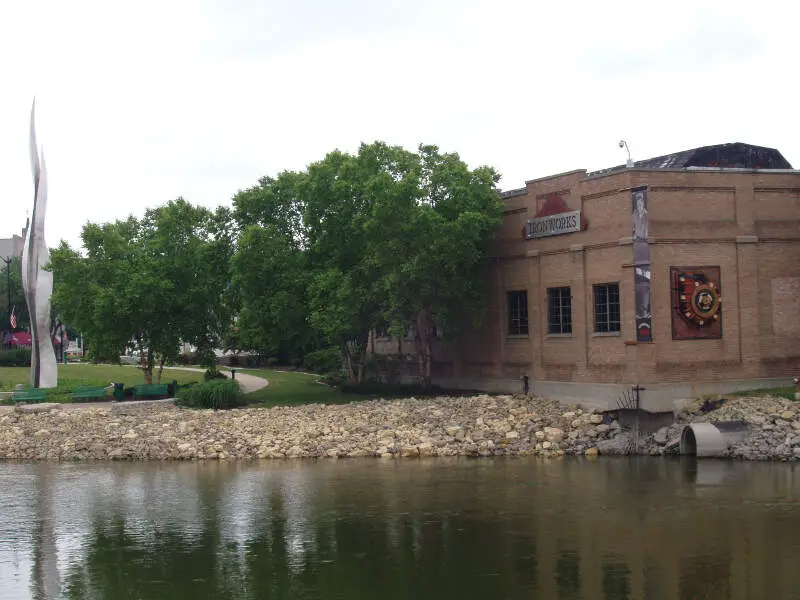
Beloit, WI Photos


1 Reviews & Comments About Beloit

...I live in Beloit...SO.
First of all, no one calls it 'Betroit'
There are not as many crimes.
And I've never seen a person with a '40', a pistol, a pitbull, and a beat-up car. ._.
Rankings & Articles For Beloit


Locations Around Beloit
Map Of Beloit, WI
Best Places Around Beloit
Rockton, IL
Population 7,974
Roscoe, IL
Population 10,706
Belvidere, IL
Population 24,752
Machesney Park, IL
Population 22,630
South Beloit, IL
Population 7,946
Milton, WI
Population 5,706
Loves Park, IL
Population 23,502
Janesville, WI
Population 66,030
Rockford, IL
Population 147,521
Beloit Demographics And Statistics
Population over time in Beloit
The current population in Beloit is 36,534. The population has decreased 1.3% from 2010.
| Year | Population | % Change |
|---|---|---|
| 2024 | 36,534 | -0.1% |
| 2023 | 36,554 | -0.2% |
| 2022 | 36,642 | 0.2% |
| 2021 | 36,567 | -0.6% |
| 2020 | 36,804 | -0.1% |
| 2019 | 36,836 | 0.1% |
| 2018 | 36,813 | 0.2% |
| 2017 | 36,733 | -0.2% |
| 2016 | 36,812 | -0.1% |
| 2015 | 36,858 | -0.0% |
| 2014 | 36,876 | -0.1% |
| 2013 | 36,921 | -0.1% |
| 2012 | 36,943 | -0.3% |
| 2011 | 37,037 | 0.0% |
| 2010 | 37,020 | - |
Race / Ethnicity in Beloit
See the full breakdown
Beloit is:
59.4% White with 21,688 White residents.
13.9% African American with 5,069 African American residents.
0.0% American Indian with 3 American Indian residents.
0.8% Asian with 293 Asian residents.
0.0% Hawaiian with 0 Hawaiian residents.
0.1% Other with 22 Other residents.
4.9% Two Or More with 1,779 Two Or More residents.
21.0% Hispanic with 7,680 Hispanic residents.
| Race | Beloit | WI | USA |
|---|---|---|---|
| White | 59.4% | 78.6% | 57.4% |
| African American | 13.9% | 5.9% | 11.9% |
| American Indian | 0.0% | 0.5% | 0.5% |
| Asian | 0.8% | 2.9% | 5.9% |
| Hawaiian | 0.0% | 0.0% | 0.2% |
| Other | 0.1% | 0.3% | 0.6% |
| Two Or More | 4.9% | 3.7% | 4.3% |
| Hispanic | 21.0% | 8.0% | 19.3% |
Gender in Beloit
See the full breakdown
Beloit is 50.3% female with 18,390 female residents.
Beloit is 49.7% male with 18,144 male residents.
| Gender | Beloit | WI | USA |
|---|---|---|---|
| Female | 50.3% | 49.9% | 50.5% |
| Male | 49.7% | 50.1% | 49.5% |
Highest level of educational attainment in Beloit for adults over 25
See the full breakdown
5.0% of adults in Beloit completed < 9th grade.
8.0% of adults in Beloit completed 9-12th grade.
37.0% of adults in Beloit completed high school / ged.
22.0% of adults in Beloit completed some college.
10.0% of adults in Beloit completed associate's degree.
13.0% of adults in Beloit completed bachelor's degree.
3.0% of adults in Beloit completed master's degree.
1.0% of adults in Beloit completed professional degree.
1.0% of adults in Beloit completed doctorate degree.
| Education | Beloit | WI | USA |
|---|---|---|---|
| < 9th Grade | 5.0% | 4.0% | 4.0% |
| 9-12th Grade | 8.0% | 4.0% | 6.0% |
| High School / GED | 37.0% | 29.0% | 26.0% |
| Some College | 22.0% | 19.0% | 19.0% |
| Associate's Degree | 10.0% | 11.0% | 9.0% |
| Bachelor's Degree | 13.0% | 22.0% | 22.0% |
| Master's Degree | 3.0% | 8.0% | 10.0% |
| Professional Degree | 1.0% | 2.0% | 2.0% |
| Doctorate Degree | 1.0% | 1.0% | 2.0% |
Household Income For Beloit, Wisconsin
See the full breakdown
6.1% of households in Beloit earn Less than $10,000.
4.2% of households in Beloit earn $10,000 to $14,999.
7.0% of households in Beloit earn $15,000 to $24,999.
8.7% of households in Beloit earn $25,000 to $34,999.
13.8% of households in Beloit earn $35,000 to $49,999.
19.2% of households in Beloit earn $50,000 to $74,999.
15.9% of households in Beloit earn $75,000 to $99,999.
13.8% of households in Beloit earn $100,000 to $149,999.
6.6% of households in Beloit earn $150,000 to $199,999.
4.8% of households in Beloit earn $200,000 or more.
| Income | Beloit | WI | USA |
|---|---|---|---|
| Less than $10,000 | 6.1% | 4.1% | 5.0% |
| $10,000 to $14,999 | 4.2% | 3.0% | 3.4% |
| $15,000 to $24,999 | 7.0% | 5.9% | 6.3% |
| $25,000 to $34,999 | 8.7% | 7.2% | 6.6% |
| $35,000 to $49,999 | 13.8% | 10.8% | 10.1% |
| $50,000 to $74,999 | 19.2% | 17.5% | 15.5% |
| $75,000 to $99,999 | 15.9% | 13.8% | 12.6% |
| $100,000 to $149,999 | 13.8% | 19.1% | 17.5% |
| $150,000 to $199,999 | 6.6% | 9.4% | 9.6% |
| $200,000 or more | 4.8% | 9.2% | 13.4% |
Source: U.S. Census ACS 5-year estimates (2024)


