Rockford SnackAbility
Overall SnackAbility
Crime in Rockford summary. We use data from the FBI to determine the crime rates in Rockford. Key points include:
There were 5,226 total crimes in Rockford in the last reporting year.
The overall crime rate per 100,000 people in Rockford is 3,597.2 / 100k people.
The violent crime rate per 100,000 people in Rockford is 1,080.0 / 100k people.
The property crime rate per 100,000 people in Rockford is 2,517.2 / 100k people.
Overall, crime in Rockford is 69.74% above the national average.
Total Crimes
Above National Average
Crime In Rockford Comparison Table
| Statistic | Count Raw |
Rockford / 100k People |
Illinois / 100k People |
National / 100k People |
|---|---|---|---|---|
| Total Crimes Per 100K | 5,226 | 3,597.2 | 2,004.4 | 2,119.2 |
| Violent Crime | 1,569 | 1,080.0 | 289.2 | 359.0 |
| Murder | 19 | 13.1 | 5.8 | 5.0 |
| Robbery | 155 | 106.7 | 90.2 | 61.0 |
| Aggravated Assault | 1,294 | 890.7 | 146.3 | 256.0 |
| Property Crime | 3,657 | 2,517.2 | 1,715.2 | 1,760.0 |
| Burglary | 919 | 632.6 | 290.5 | 229.0 |
| Larceny | 2,099 | 1,444.8 | 1,134.4 | 1,272.0 |
| Car Theft | 639 | 439.8 | 290.4 | 259.0 |
Source: FBI Uniform Crime Reporting (2024)
Cost of living in Rockford summary. We use data on the cost of living to determine how expensive it is to live in Rockford. Real estate prices drive most of the variance in cost of living around Illinois. Key points include:
The cost of living in Rockford is 89 with 100 being average.
The cost of living in Rockford is 0.9x lower than the national average.
The median home value in Rockford is $177,225.
The median income in Rockford is $54,752.
Rockford's Overall Cost Of Living
Lower Than The National Average
Cost Of Living In Rockford Comparison Table
| Living Expense | Rockford | Illinois | National Average |
|---|---|---|---|
| Overall | 89 | 98 | 100 |
| Services | 97 | 99 | 100 |
| Groceries | 96 | 99 | 100 |
| Health | 60 | 96 | 100 |
| Housing | 98 | 101 | 100 |
| Transportation | 97 | 99 | 100 |
| Utilities | 96 | 101 | 100 |
Source: Cost of living index, normalized to US average = 100
Rockford, IL Weather
The average high in Rockford is 58.1° and the average low is 38.2°.
There are 68.9 days of precipitation each year.
Expect an average of 35.2 inches of precipitation each year with 35.7 inches of snow.
| Stat | Rockford |
|---|---|
| Average Annual High | 58.1 |
| Average Annual Low | 38.2 |
| Annual Precipitation Days | 68.9 |
| Average Annual Precipitation | 35.2 |
| Average Annual Snowfall | 35.7 |
Average High
Days of Rain
Source: NOAA climate normals (30-year)
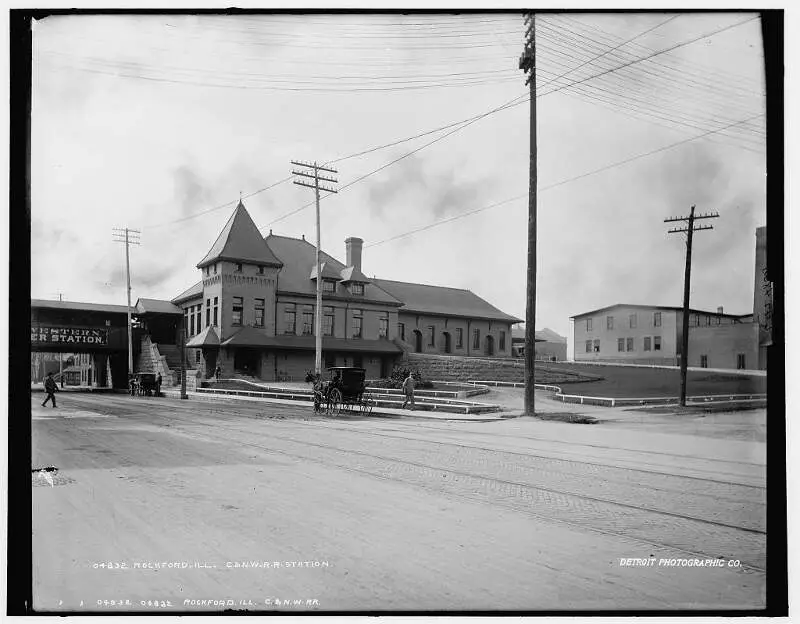
Rockford, IL Photos


3 Reviews & Comments About Rockford

Rockford is a crime filled, dirty city, with no one really caring you are there or not.
Looks of criminal looking people walking around and it was shady. Bad experience.
Rockford is one of the more depressing Illinois bigger cities. There really is a terrible night life, day life - it tries but ultimately fails in bringing in culture from Chicago or even the suburbs.
Be careful crossing the river - it gets a little sketch.
Rockford was on the news recently as being the #1 highest violent crime in Illinois and #3 in the nation. I live in Rockford, and it is very violent. Recent being May 2016.
Rankings & Articles For Rockford


Locations Around Rockford
Map Of Rockford, IL
Best Places Around Rockford
Rockton, IL
Population 7,974
Roscoe, IL
Population 10,706
Belvidere, IL
Population 24,752
Machesney Park, IL
Population 22,630
South Beloit, IL
Population 7,946
Loves Park, IL
Population 23,502
Beloit, WI
Population 36,534
Rockford Demographics And Statistics
Population over time in Rockford
The current population in Rockford is 147,521. The population has decreased 4.5% from 2010.
| Year | Population | % Change |
|---|---|---|
| 2024 | 147,521 | -0.1% |
| 2023 | 147,649 | -0.4% |
| 2022 | 148,173 | -0.5% |
| 2021 | 148,942 | 1.0% |
| 2020 | 147,441 | 0.3% |
| 2019 | 147,070 | -0.5% |
| 2018 | 147,881 | -0.5% |
| 2017 | 148,640 | -0.6% |
| 2016 | 149,597 | -0.5% |
| 2015 | 150,283 | -0.7% |
| 2014 | 151,290 | -0.6% |
| 2013 | 152,138 | -0.5% |
| 2012 | 152,948 | -0.4% |
| 2011 | 153,509 | -0.7% |
| 2010 | 154,517 | - |
Race / Ethnicity in Rockford
See the full breakdown
Rockford is:
49.6% White with 73,144 White residents.
19.2% African American with 28,272 African American residents.
0.2% American Indian with 226 American Indian residents.
3.7% Asian with 5,401 Asian residents.
0.0% Hawaiian with 71 Hawaiian residents.
0.3% Other with 477 Other residents.
5.5% Two Or More with 8,114 Two Or More residents.
21.6% Hispanic with 31,816 Hispanic residents.
| Race | Rockford | IL | USA |
|---|---|---|---|
| White | 49.6% | 58.1% | 57.4% |
| African American | 19.2% | 13.3% | 11.9% |
| American Indian | 0.2% | 0.1% | 0.5% |
| Asian | 3.7% | 5.9% | 5.9% |
| Hawaiian | 0.0% | 0.0% | 0.2% |
| Other | 0.3% | 0.4% | 0.6% |
| Two Or More | 5.5% | 3.4% | 4.3% |
| Hispanic | 21.6% | 18.8% | 19.3% |
Gender in Rockford
See the full breakdown
Rockford is 51.5% female with 75,963 female residents.
Rockford is 48.5% male with 71,558 male residents.
| Gender | Rockford | IL | USA |
|---|---|---|---|
| Female | 51.5% | 50.6% | 50.5% |
| Male | 48.5% | 49.4% | 49.5% |
Highest level of educational attainment in Rockford for adults over 25
See the full breakdown
5.0% of adults in Rockford completed < 9th grade.
10.0% of adults in Rockford completed 9-12th grade.
30.0% of adults in Rockford completed high school / ged.
22.0% of adults in Rockford completed some college.
9.0% of adults in Rockford completed associate's degree.
15.0% of adults in Rockford completed bachelor's degree.
6.0% of adults in Rockford completed master's degree.
2.0% of adults in Rockford completed professional degree.
1.0% of adults in Rockford completed doctorate degree.
| Education | Rockford | IL | USA |
|---|---|---|---|
| < 9th Grade | 5.0% | 5.0% | 4.0% |
| 9-12th Grade | 10.0% | 5.0% | 6.0% |
| High School / GED | 30.0% | 25.0% | 26.0% |
| Some College | 22.0% | 19.0% | 19.0% |
| Associate's Degree | 9.0% | 8.0% | 9.0% |
| Bachelor's Degree | 15.0% | 23.0% | 22.0% |
| Master's Degree | 6.0% | 11.0% | 10.0% |
| Professional Degree | 2.0% | 2.0% | 2.0% |
| Doctorate Degree | 1.0% | 2.0% | 2.0% |
Household Income For Rockford, Illinois
See the full breakdown
7.4% of households in Rockford earn Less than $10,000.
6.0% of households in Rockford earn $10,000 to $14,999.
10.4% of households in Rockford earn $15,000 to $24,999.
9.4% of households in Rockford earn $25,000 to $34,999.
13.5% of households in Rockford earn $35,000 to $49,999.
17.8% of households in Rockford earn $50,000 to $74,999.
12.3% of households in Rockford earn $75,000 to $99,999.
12.5% of households in Rockford earn $100,000 to $149,999.
5.6% of households in Rockford earn $150,000 to $199,999.
4.9% of households in Rockford earn $200,000 or more.
| Income | Rockford | IL | USA |
|---|---|---|---|
| Less than $10,000 | 7.4% | 5.4% | 5.0% |
| $10,000 to $14,999 | 6.0% | 3.2% | 3.4% |
| $15,000 to $24,999 | 10.4% | 5.9% | 6.3% |
| $25,000 to $34,999 | 9.4% | 6.3% | 6.6% |
| $35,000 to $49,999 | 13.5% | 9.7% | 10.1% |
| $50,000 to $74,999 | 17.8% | 14.8% | 15.5% |
| $75,000 to $99,999 | 12.3% | 12.6% | 12.6% |
| $100,000 to $149,999 | 12.5% | 18.0% | 17.5% |
| $150,000 to $199,999 | 5.6% | 10.1% | 9.6% |
| $200,000 or more | 4.9% | 13.8% | 13.4% |
Source: U.S. Census ACS 5-year estimates (2024)


