Manitowoc SnackAbility
Overall SnackAbility
Crime in Manitowoc summary. We use data from the FBI to determine the crime rates in Manitowoc. Key points include:
There were 407 total crimes in Manitowoc in the last reporting year.
The overall crime rate per 100,000 people in Manitowoc is 1,178.1 / 100k people.
The violent crime rate per 100,000 people in Manitowoc is 208.4 / 100k people.
The property crime rate per 100,000 people in Manitowoc is 969.7 / 100k people.
Overall, crime in Manitowoc is -44.41% below the national average.
Total Crimes
Below National Average
Crime In Manitowoc Comparison Table
| Statistic | Count Raw |
Manitowoc / 100k People |
Wisconsin / 100k People |
National / 100k People |
|---|---|---|---|---|
| Total Crimes Per 100K | 407 | 1,178.1 | 1,432.6 | 2,119.2 |
| Violent Crime | 72 | 208.4 | 278.5 | 359.0 |
| Murder | 0 | 0.0 | 4.2 | 5.0 |
| Robbery | 5 | 14.5 | 39.4 | 61.0 |
| Aggravated Assault | 59 | 170.8 | 200.1 | 256.0 |
| Property Crime | 335 | 969.7 | 1,154.1 | 1,760.0 |
| Burglary | 24 | 69.5 | 117.2 | 229.0 |
| Larceny | 293 | 848.1 | 875.6 | 1,272.0 |
| Car Theft | 18 | 52.1 | 161.3 | 259.0 |
Source: FBI Uniform Crime Reporting (2024)
Cost of living in Manitowoc summary. We use data on the cost of living to determine how expensive it is to live in Manitowoc. Real estate prices drive most of the variance in cost of living around Wisconsin. Key points include:
The cost of living in Manitowoc is 90 with 100 being average.
The cost of living in Manitowoc is 0.9x lower than the national average.
The median home value in Manitowoc is $235,894.
The median income in Manitowoc is $63,757.
Manitowoc's Overall Cost Of Living
Lower Than The National Average
Cost Of Living In Manitowoc Comparison Table
| Living Expense | Manitowoc | Wisconsin | National Average |
|---|---|---|---|
| Overall | 90 | 98 | 100 |
| Services | 99 | 98 | 100 |
| Groceries | 97 | 100 | 100 |
| Health | 63 | 91 | 100 |
| Housing | 94 | 99 | 100 |
| Transportation | 101 | 102 | 100 |
| Utilities | 95 | 100 | 100 |
Source: Cost of living index, normalized to US average = 100
Manitowoc, WI Weather
The average high in Manitowoc is 53.3° and the average low is 37.2°.
There are 66.0 days of precipitation each year.
Expect an average of 30.5 inches of precipitation each year with 41.8 inches of snow.
| Stat | Manitowoc |
|---|---|
| Average Annual High | 53.3 |
| Average Annual Low | 37.2 |
| Annual Precipitation Days | 66.0 |
| Average Annual Precipitation | 30.5 |
| Average Annual Snowfall | 41.8 |
Average High
Days of Rain
Source: NOAA climate normals (30-year)
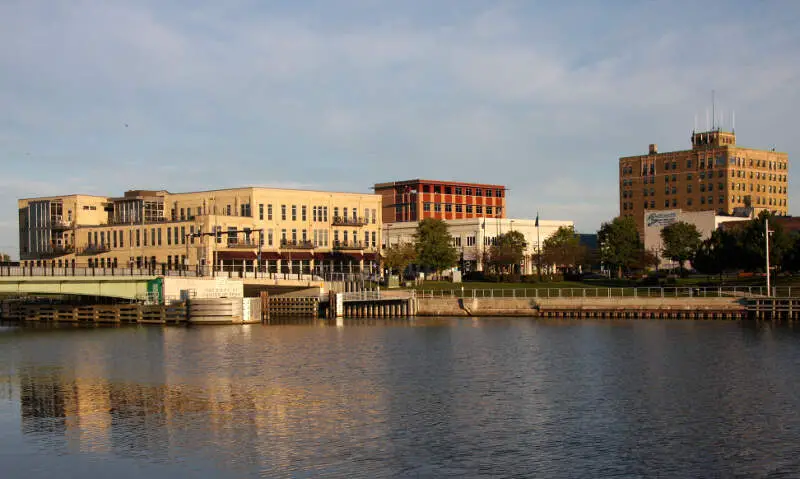
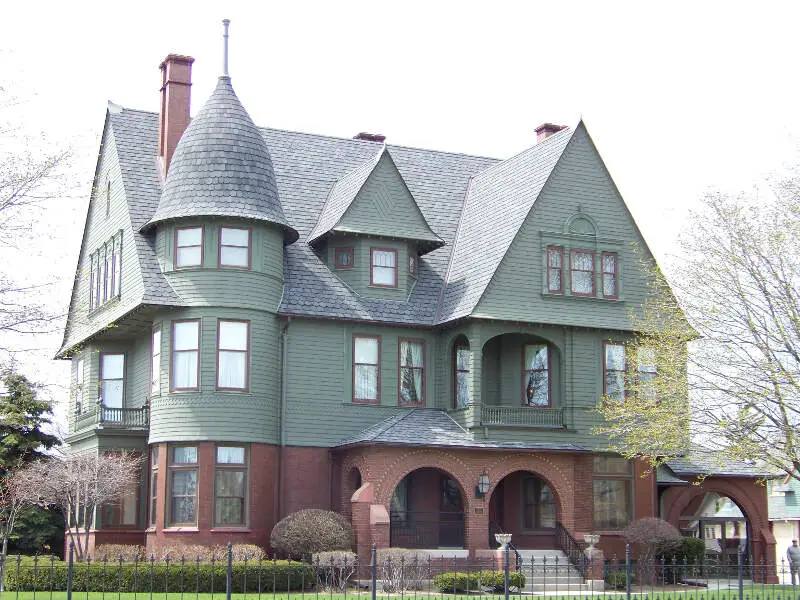
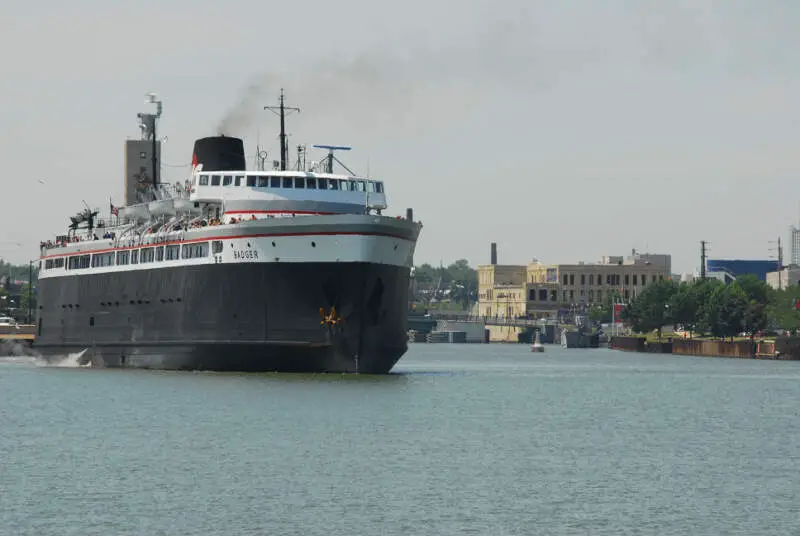
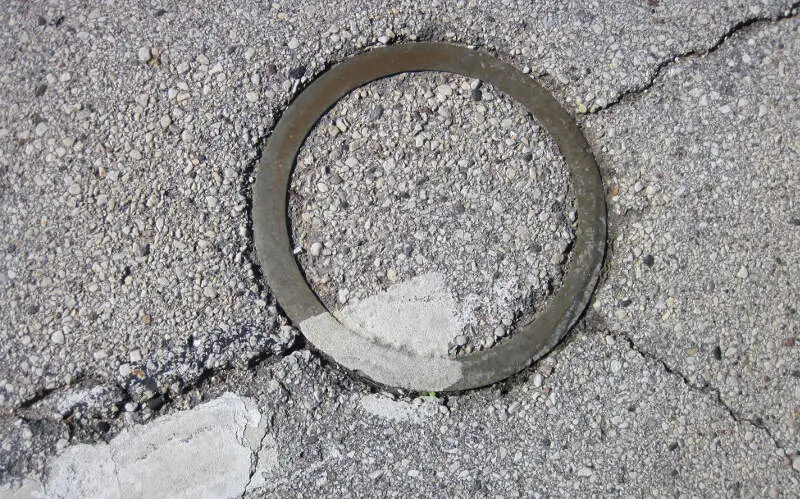
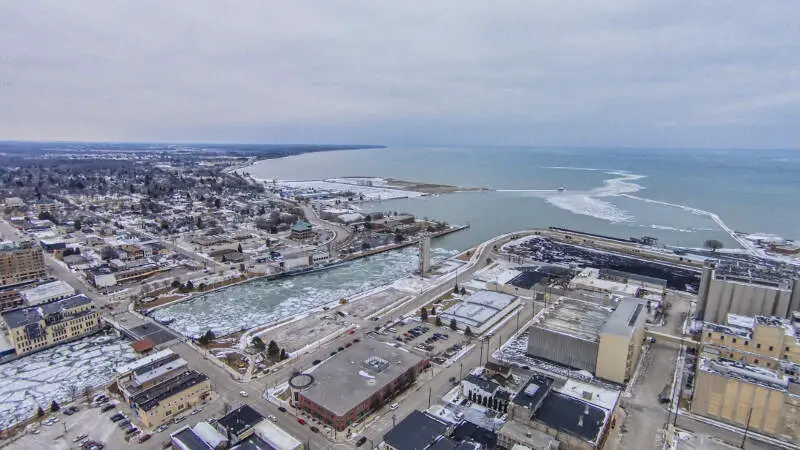
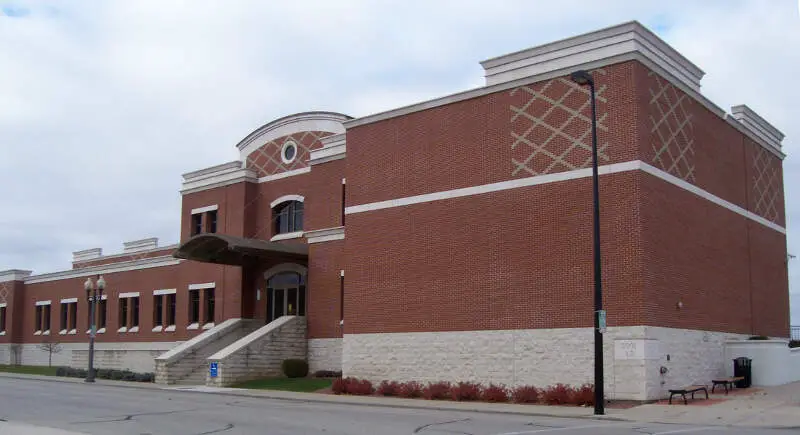
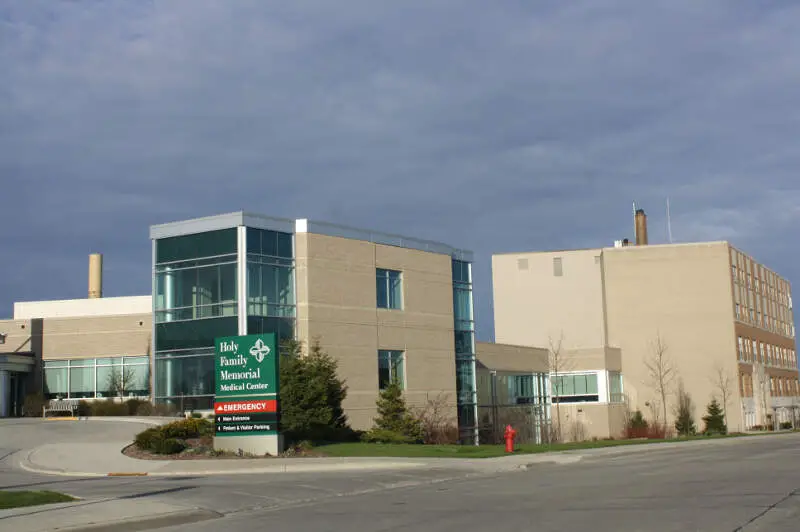
Manitowoc, WI Photos


Rankings & Articles For Manitowoc


Locations Around Manitowoc
Map Of Manitowoc, WI
Best Places Around Manitowoc
Sheboygan Falls, WI
Population 8,547
Allouez, WI
Population 13,975
Suamico, WI
Population 12,985
Suamico, WI
Population 12,985
Hobart, WI
Population 10,610
Hobart, WI
Population 10,610
De Pere, WI
Population 25,301
Menasha, WI
Population 18,273
Kaukauna, WI
Population 17,706
Plymouth, WI
Population 8,890
Manitowoc Demographics And Statistics
Population over time in Manitowoc
The current population in Manitowoc is 34,620. The population has increased 2.4% from 2010.
| Year | Population | % Change |
|---|---|---|
| 2024 | 34,620 | 0.2% |
| 2023 | 34,553 | 0.2% |
| 2022 | 34,500 | 0.7% |
| 2021 | 34,267 | 5.2% |
| 2020 | 32,558 | -0.4% |
| 2019 | 32,702 | -0.3% |
| 2018 | 32,798 | -0.4% |
| 2017 | 32,939 | -0.7% |
| 2016 | 33,183 | -0.4% |
| 2015 | 33,301 | -0.4% |
| 2014 | 33,443 | -0.3% |
| 2013 | 33,548 | -0.3% |
| 2012 | 33,646 | -0.3% |
| 2011 | 33,737 | -0.2% |
| 2010 | 33,793 | - |
Race / Ethnicity in Manitowoc
See the full breakdown
Manitowoc is:
83.0% White with 28,750 White residents.
1.5% African American with 515 African American residents.
0.1% American Indian with 23 American Indian residents.
4.7% Asian with 1,633 Asian residents.
0.0% Hawaiian with 0 Hawaiian residents.
0.3% Other with 114 Other residents.
3.8% Two Or More with 1,314 Two Or More residents.
6.6% Hispanic with 2,271 Hispanic residents.
| Race | Manitowoc | WI | USA |
|---|---|---|---|
| White | 83.0% | 78.6% | 57.4% |
| African American | 1.5% | 5.9% | 11.9% |
| American Indian | 0.1% | 0.5% | 0.5% |
| Asian | 4.7% | 2.9% | 5.9% |
| Hawaiian | 0.0% | 0.0% | 0.2% |
| Other | 0.3% | 0.3% | 0.6% |
| Two Or More | 3.8% | 3.7% | 4.3% |
| Hispanic | 6.6% | 8.0% | 19.3% |
Gender in Manitowoc
See the full breakdown
Manitowoc is 50.3% female with 17,411 female residents.
Manitowoc is 49.7% male with 17,209 male residents.
| Gender | Manitowoc | WI | USA |
|---|---|---|---|
| Female | 50.3% | 49.9% | 50.5% |
| Male | 49.7% | 50.1% | 49.5% |
Highest level of educational attainment in Manitowoc for adults over 25
See the full breakdown
3.0% of adults in Manitowoc completed < 9th grade.
6.0% of adults in Manitowoc completed 9-12th grade.
34.0% of adults in Manitowoc completed high school / ged.
21.0% of adults in Manitowoc completed some college.
11.0% of adults in Manitowoc completed associate's degree.
18.0% of adults in Manitowoc completed bachelor's degree.
5.0% of adults in Manitowoc completed master's degree.
2.0% of adults in Manitowoc completed professional degree.
0.0% of adults in Manitowoc completed doctorate degree.
| Education | Manitowoc | WI | USA |
|---|---|---|---|
| < 9th Grade | 3.0% | 4.0% | 4.0% |
| 9-12th Grade | 6.0% | 4.0% | 6.0% |
| High School / GED | 34.0% | 29.0% | 26.0% |
| Some College | 21.0% | 19.0% | 19.0% |
| Associate's Degree | 11.0% | 11.0% | 9.0% |
| Bachelor's Degree | 18.0% | 22.0% | 22.0% |
| Master's Degree | 5.0% | 8.0% | 10.0% |
| Professional Degree | 2.0% | 2.0% | 2.0% |
| Doctorate Degree | 0.0% | 1.0% | 2.0% |
Household Income For Manitowoc, Wisconsin
See the full breakdown
4.4% of households in Manitowoc earn Less than $10,000.
4.6% of households in Manitowoc earn $10,000 to $14,999.
6.7% of households in Manitowoc earn $15,000 to $24,999.
7.9% of households in Manitowoc earn $25,000 to $34,999.
13.2% of households in Manitowoc earn $35,000 to $49,999.
22.2% of households in Manitowoc earn $50,000 to $74,999.
14.2% of households in Manitowoc earn $75,000 to $99,999.
15.9% of households in Manitowoc earn $100,000 to $149,999.
6.4% of households in Manitowoc earn $150,000 to $199,999.
4.4% of households in Manitowoc earn $200,000 or more.
| Income | Manitowoc | WI | USA |
|---|---|---|---|
| Less than $10,000 | 4.4% | 4.1% | 5.0% |
| $10,000 to $14,999 | 4.6% | 3.0% | 3.4% |
| $15,000 to $24,999 | 6.7% | 5.9% | 6.3% |
| $25,000 to $34,999 | 7.9% | 7.2% | 6.6% |
| $35,000 to $49,999 | 13.2% | 10.8% | 10.1% |
| $50,000 to $74,999 | 22.2% | 17.5% | 15.5% |
| $75,000 to $99,999 | 14.2% | 13.8% | 12.6% |
| $100,000 to $149,999 | 15.9% | 19.1% | 17.5% |
| $150,000 to $199,999 | 6.4% | 9.4% | 9.6% |
| $200,000 or more | 4.4% | 9.2% | 13.4% |
Source: U.S. Census ACS 5-year estimates (2024)


