Merrill SnackAbility
Overall SnackAbility
Crime in Merrill summary. We use data from the FBI to determine the crime rates in Merrill. Key points include:
There were 236 total crimes in Merrill in the last reporting year.
The overall crime rate per 100,000 people in Merrill is 2,620.5 / 100k people.
The violent crime rate per 100,000 people in Merrill is 199.9 / 100k people.
The property crime rate per 100,000 people in Merrill is 2,420.6 / 100k people.
Overall, crime in Merrill is 23.65% above the national average.
Total Crimes
Above National Average
Crime In Merrill Comparison Table
| Statistic | Count Raw |
Merrill / 100k People |
Wisconsin / 100k People |
National / 100k People |
|---|---|---|---|---|
| Total Crimes Per 100K | 236 | 2,620.5 | 1,432.6 | 2,119.2 |
| Violent Crime | 18 | 199.9 | 278.5 | 359.0 |
| Murder | 0 | 0.0 | 4.2 | 5.0 |
| Robbery | 1 | 11.1 | 39.4 | 61.0 |
| Aggravated Assault | 15 | 166.6 | 200.1 | 256.0 |
| Property Crime | 218 | 2,420.6 | 1,154.1 | 1,760.0 |
| Burglary | 10 | 111.0 | 117.2 | 229.0 |
| Larceny | 203 | 2,254.1 | 875.6 | 1,272.0 |
| Car Theft | 5 | 55.5 | 161.3 | 259.0 |
Source: FBI Uniform Crime Reporting (2024)
Cost of living in Merrill summary. We use data on the cost of living to determine how expensive it is to live in Merrill. Real estate prices drive most of the variance in cost of living around Wisconsin. Key points include:
The cost of living in Merrill is 86 with 100 being average.
The cost of living in Merrill is 0.9x lower than the national average.
The median home value in Merrill is $218,029.
The median income in Merrill is $53,148.
Merrill's Overall Cost Of Living
Lower Than The National Average
Cost Of Living In Merrill Comparison Table
| Living Expense | Merrill | Wisconsin | National Average |
|---|---|---|---|
| Overall | 86 | 98 | 100 |
| Services | 95 | 98 | 100 |
| Groceries | 98 | 100 | 100 |
| Health | 53 | 91 | 100 |
| Housing | 102 | 99 | 100 |
| Transportation | 100 | 102 | 100 |
| Utilities | 98 | 100 | 100 |
Source: Cost of living index, normalized to US average = 100
Merrill, WI Weather
The average high in Merrill is 52.5° and the average low is 31.5°.
There are 70.0 days of precipitation each year.
Expect an average of 32.1 inches of precipitation each year with 52.4 inches of snow.
| Stat | Merrill |
|---|---|
| Average Annual High | 52.5 |
| Average Annual Low | 31.5 |
| Annual Precipitation Days | 70.0 |
| Average Annual Precipitation | 32.1 |
| Average Annual Snowfall | 52.4 |
Average High
Days of Rain
Source: NOAA climate normals (30-year)
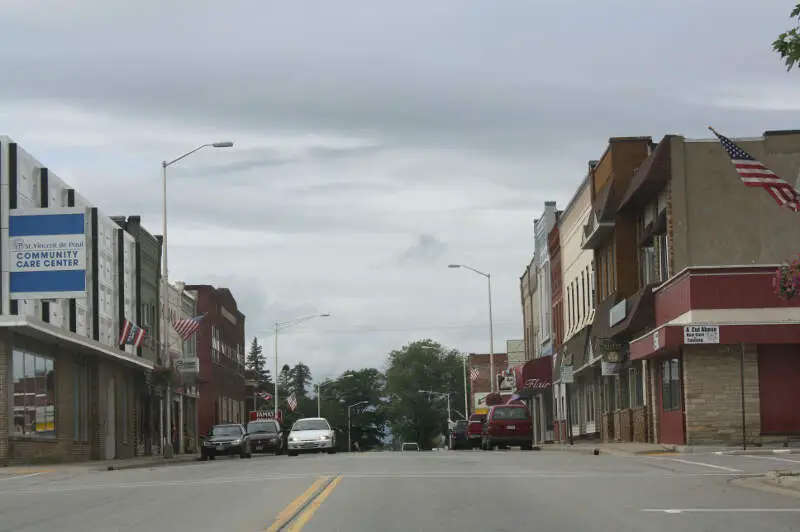
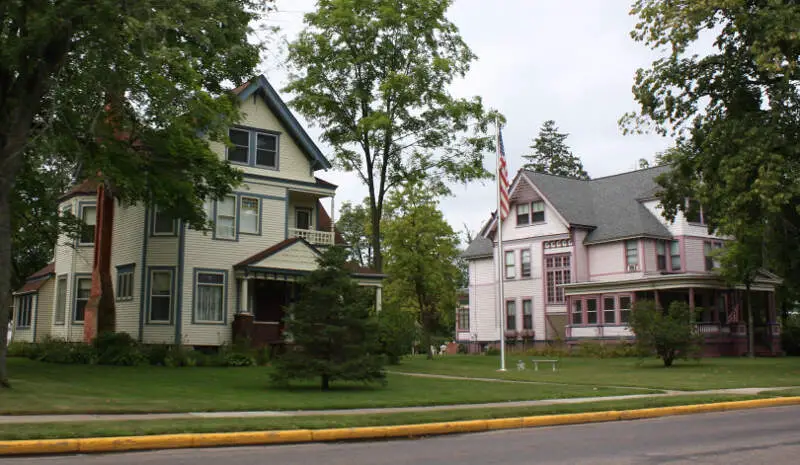
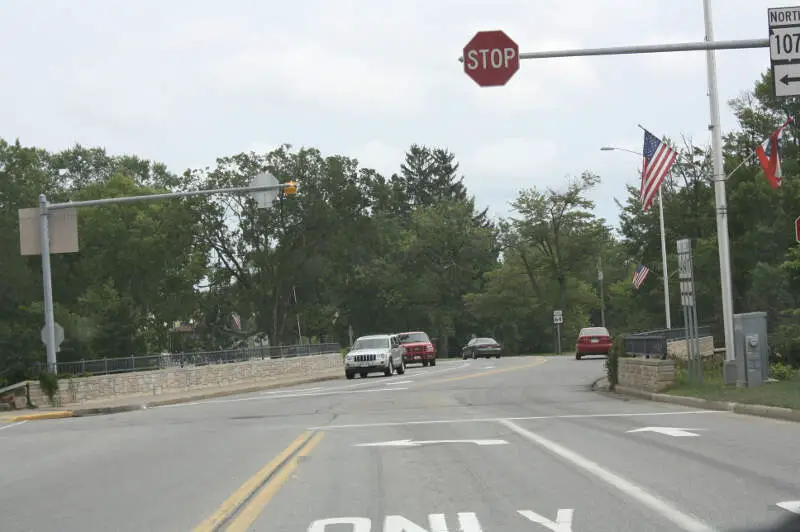
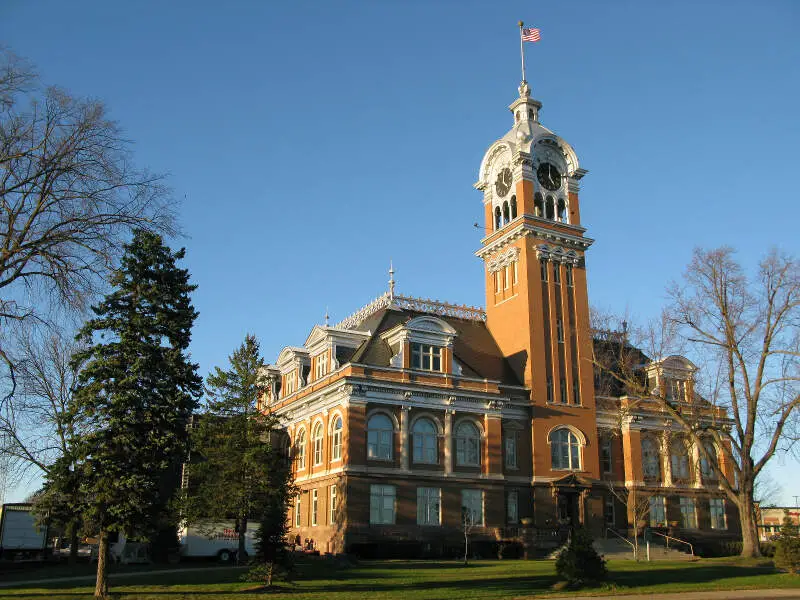
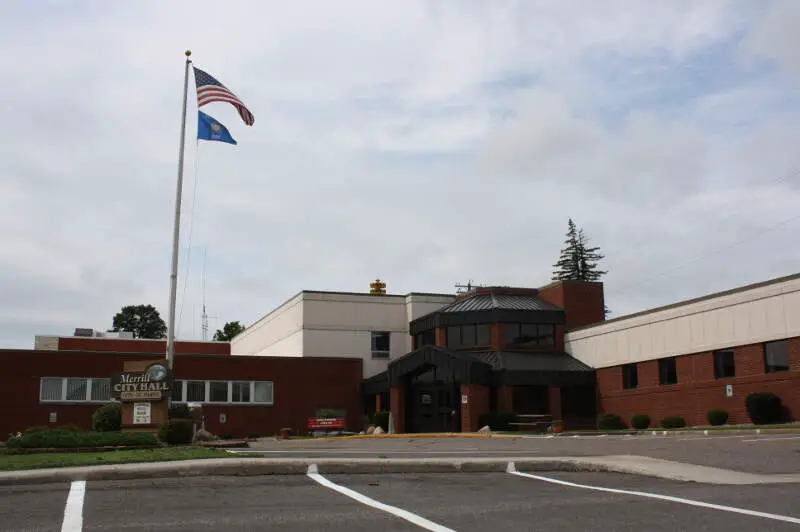
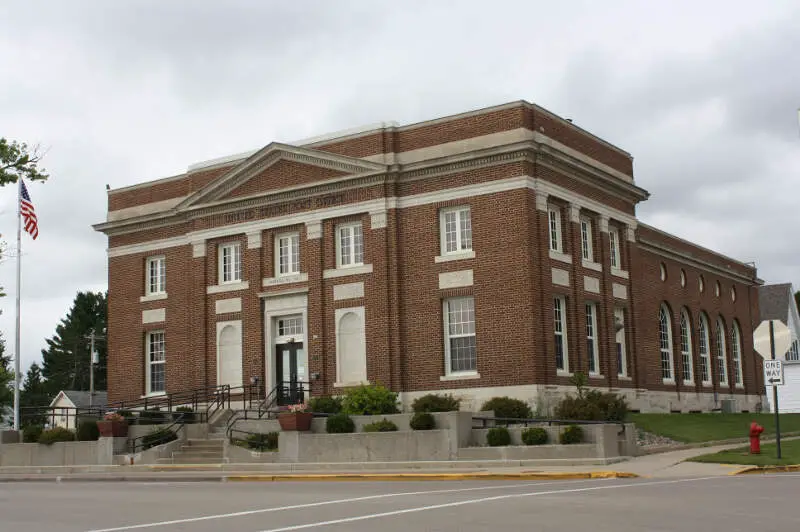
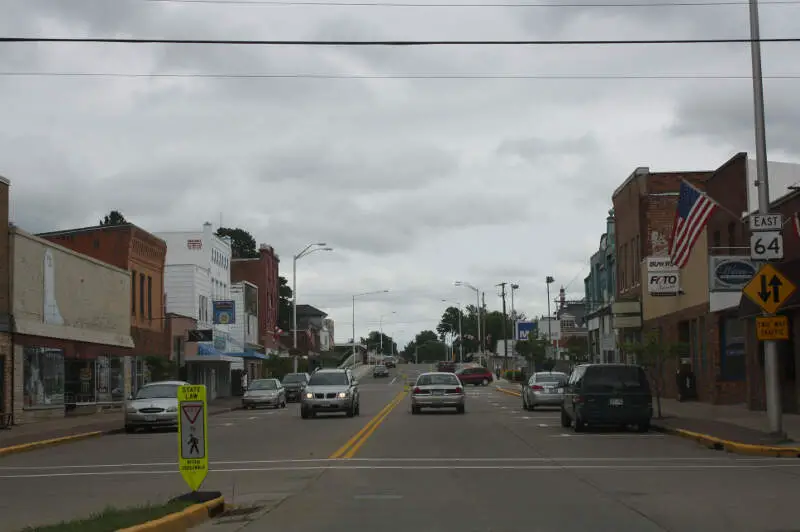
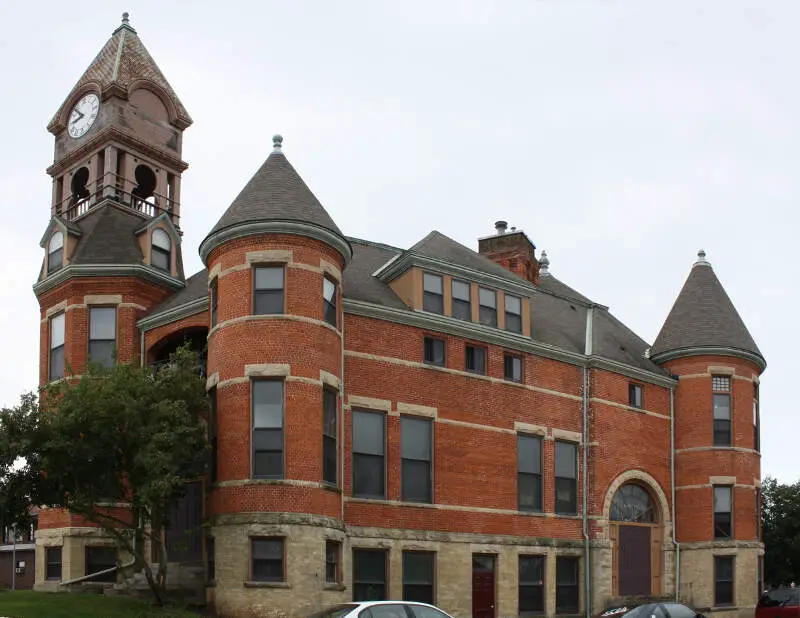
Merrill, WI Photos

Rankings & Articles For Merrill


Locations Around Merrill
Map Of Merrill, WI
Best Places Around Merrill
Kronenwetter, WI
Population 8,395
Kronenwetter, WI
Population 8,395
Rothschild, WI
Population 5,600
Weston, WI
Population 15,749
Marshfield, WI
Population 18,700
Wausau, WI
Population 39,996
Stevens Point, WI
Population 25,785
Antigo, WI
Population 8,069
Rhinelander, WI
Population 8,316
Merrill Demographics And Statistics
Population over time in Merrill
The current population in Merrill is 9,356. The population has decreased 4.5% from 2010.
| Year | Population | % Change |
|---|---|---|
| 2024 | 9,356 | 1.4% |
| 2023 | 9,224 | -0.5% |
| 2022 | 9,266 | -0.8% |
| 2021 | 9,344 | 2.9% |
| 2020 | 9,081 | -0.3% |
| 2019 | 9,108 | -0.8% |
| 2018 | 9,178 | -0.9% |
| 2017 | 9,264 | -1.0% |
| 2016 | 9,354 | -0.7% |
| 2015 | 9,419 | -0.8% |
| 2014 | 9,491 | -0.9% |
| 2013 | 9,575 | -0.7% |
| 2012 | 9,638 | -0.9% |
| 2011 | 9,721 | -0.8% |
| 2010 | 9,800 | - |
Race / Ethnicity in Merrill
See the full breakdown
Merrill is:
91.3% White with 8,543 White residents.
0.5% African American with 45 African American residents.
0.1% American Indian with 11 American Indian residents.
0.1% Asian with 10 Asian residents.
0.0% Hawaiian with 0 Hawaiian residents.
0.0% Other with 0 Other residents.
4.0% Two Or More with 370 Two Or More residents.
4.0% Hispanic with 377 Hispanic residents.
| Race | Merrill | WI | USA |
|---|---|---|---|
| White | 91.3% | 78.6% | 57.4% |
| African American | 0.5% | 5.9% | 11.9% |
| American Indian | 0.1% | 0.5% | 0.5% |
| Asian | 0.1% | 2.9% | 5.9% |
| Hawaiian | 0.0% | 0.0% | 0.2% |
| Other | 0.0% | 0.3% | 0.6% |
| Two Or More | 4.0% | 3.7% | 4.3% |
| Hispanic | 4.0% | 8.0% | 19.3% |
Gender in Merrill
See the full breakdown
Merrill is 52.8% female with 4,941 female residents.
Merrill is 47.2% male with 4,414 male residents.
| Gender | Merrill | WI | USA |
|---|---|---|---|
| Female | 52.8% | 49.9% | 50.5% |
| Male | 47.2% | 50.1% | 49.5% |
Highest level of educational attainment in Merrill for adults over 25
See the full breakdown
3.0% of adults in Merrill completed < 9th grade.
5.0% of adults in Merrill completed 9-12th grade.
43.0% of adults in Merrill completed high school / ged.
24.0% of adults in Merrill completed some college.
10.0% of adults in Merrill completed associate's degree.
9.0% of adults in Merrill completed bachelor's degree.
5.0% of adults in Merrill completed master's degree.
0.0% of adults in Merrill completed professional degree.
1.0% of adults in Merrill completed doctorate degree.
| Education | Merrill | WI | USA |
|---|---|---|---|
| < 9th Grade | 3.0% | 4.0% | 4.0% |
| 9-12th Grade | 5.0% | 4.0% | 6.0% |
| High School / GED | 43.0% | 29.0% | 26.0% |
| Some College | 24.0% | 19.0% | 19.0% |
| Associate's Degree | 10.0% | 11.0% | 9.0% |
| Bachelor's Degree | 9.0% | 22.0% | 22.0% |
| Master's Degree | 5.0% | 8.0% | 10.0% |
| Professional Degree | 0.0% | 2.0% | 2.0% |
| Doctorate Degree | 1.0% | 1.0% | 2.0% |
Household Income For Merrill, Wisconsin
See the full breakdown
9.1% of households in Merrill earn Less than $10,000.
8.1% of households in Merrill earn $10,000 to $14,999.
9.9% of households in Merrill earn $15,000 to $24,999.
6.1% of households in Merrill earn $25,000 to $34,999.
14.5% of households in Merrill earn $35,000 to $49,999.
16.9% of households in Merrill earn $50,000 to $74,999.
12.4% of households in Merrill earn $75,000 to $99,999.
12.2% of households in Merrill earn $100,000 to $149,999.
8.0% of households in Merrill earn $150,000 to $199,999.
2.7% of households in Merrill earn $200,000 or more.
| Income | Merrill | WI | USA |
|---|---|---|---|
| Less than $10,000 | 9.1% | 4.1% | 5.0% |
| $10,000 to $14,999 | 8.1% | 3.0% | 3.4% |
| $15,000 to $24,999 | 9.9% | 5.9% | 6.3% |
| $25,000 to $34,999 | 6.1% | 7.2% | 6.6% |
| $35,000 to $49,999 | 14.5% | 10.8% | 10.1% |
| $50,000 to $74,999 | 16.9% | 17.5% | 15.5% |
| $75,000 to $99,999 | 12.4% | 13.8% | 12.6% |
| $100,000 to $149,999 | 12.2% | 19.1% | 17.5% |
| $150,000 to $199,999 | 8.0% | 9.4% | 9.6% |
| $200,000 or more | 2.7% | 9.2% | 13.4% |
Source: U.S. Census ACS 5-year estimates (2024)


